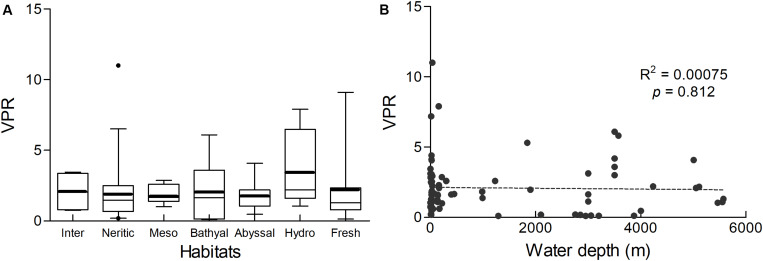
FIGURE 5.
(A) The VPR values obtained by dilution from different benthic habitats. Data were shown in Supplementary Table S1. The boxed region shows the 25th and 75th percentiles and the whiskers show the 5–95%. The thin line indicates the median and the bold line indicates the mean. Outliers are shown as black points. From left to right, the box plots represent the VPR values of the intertidal zone, continental shelf, mesobenthic zone, bathyal zone, abyssal benthic zone, hydrothermal vents and freshwater sediments, respectively. (B) The spatial pattern of VPR values along with the water depth in marine sediments.

