
Figure 2.
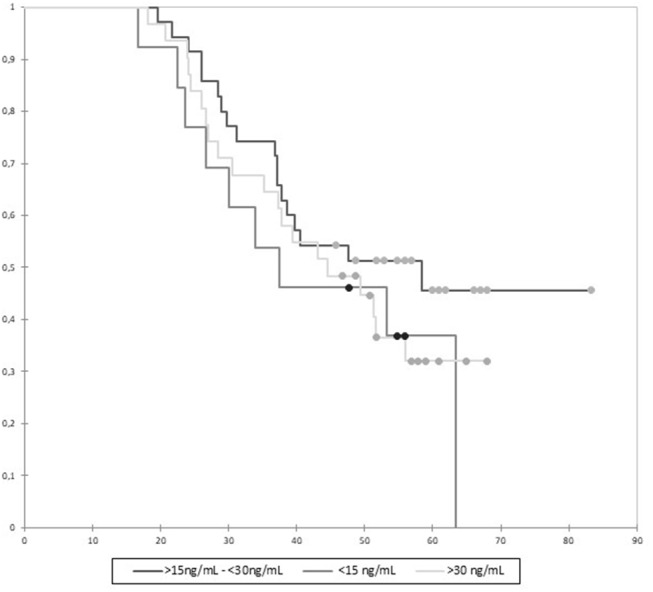
Kaplan–Meier analysis of survival according to 25OH vitamin D (VD) levels. Survival is expressed in months. Censored data are featured by full circles. Differences between groups were not significant (p = 0.88).
Official websites use .gov
A
.gov website belongs to an official
government organization in the United States.
Secure .gov websites use HTTPS
A lock (
) or https:// means you've safely
connected to the .gov website. Share sensitive
information only on official, secure websites.
Kaplan–Meier analysis of survival according to 25OH vitamin D (VD) levels. Survival is expressed in months. Censored data are featured by full circles. Differences between groups were not significant (p = 0.88).