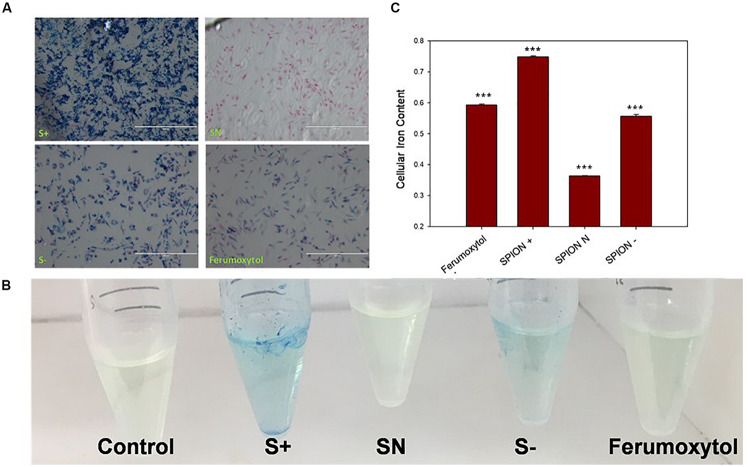
FIGURE 2.
Analysis of cell uptake of Ferumoxytol and SPIONs after Prussian blue staining. Blue, Iron content; red, nucleus. (A) In vitro quantification of SPIONs after Prussian blue staining and iron assay on RAW 264.7 cells. (B) Iron assay of cells after treated with Ferumoxytol and SPIONs. (C) Quantification analysis of iron assay in (B). ***P < 0.005, compared with control.

