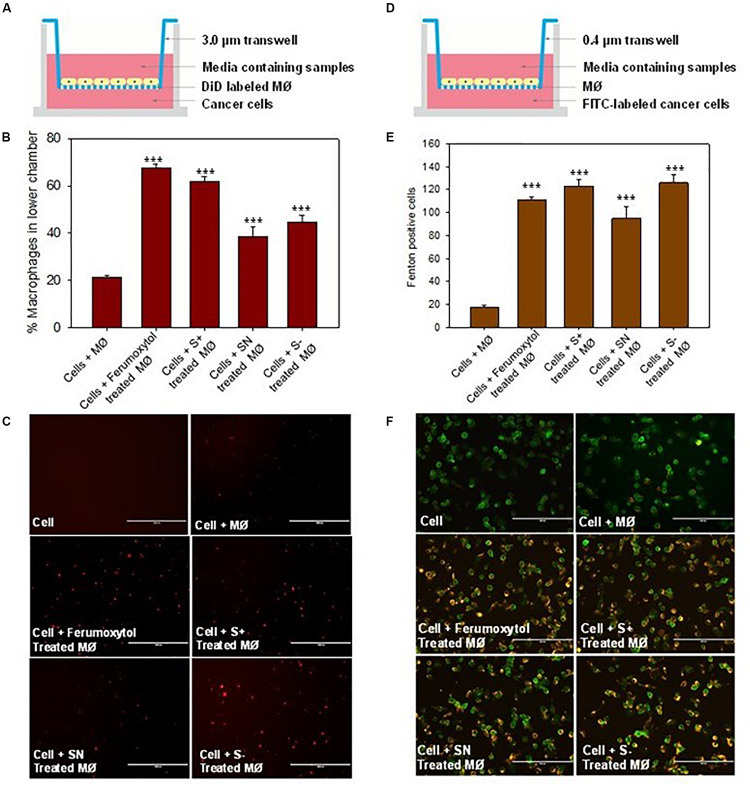
FIGURE 5.
Effect of macrophages treated with differently charged SPIONs on tumor cells. (A) Sketches of chemotaxis effect on macrophage incubated with tumor cells. (B) Percentage of macrophages on lower chamber in different groups. ***P < 0.005, compared with control (cell + macrophage). (C) The fluorescence images of DID-labeled macrophages (red) in the lower chamber. Scale bar, 1000 μm. (D) Co-incubation of macrophage and tumor cells with 0.4 μm trans well. (E) Calculation of Fenton positive tumor cells of different groups in lower chamber. ***P < 0.005, compared with control (cell + macrophage). (F) Fluorescence images of Caspase 9 (yellow) expression in tumor cells (green). Scale bar, 200 μm.

