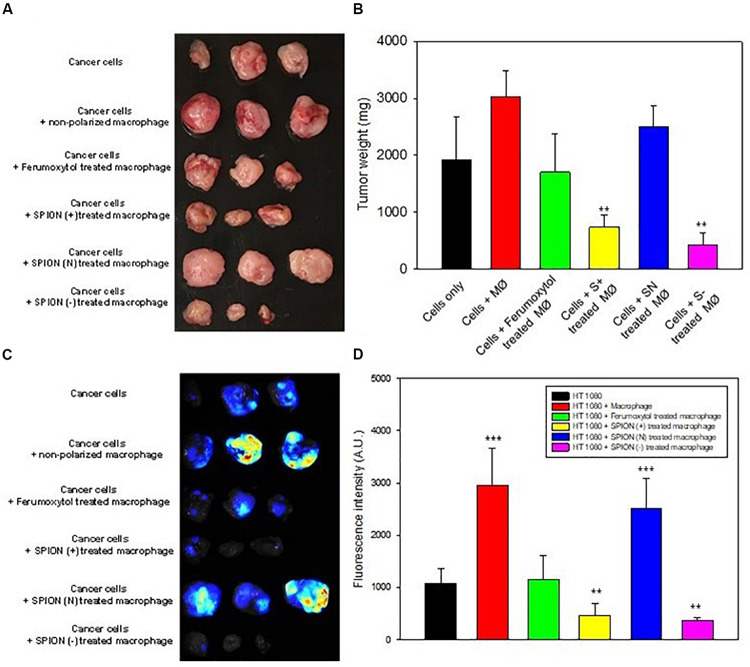
FIGURE 6.
In vivo inhibition of tumor growth. (A) Images of tumor at day 14 after representative treatment. (B) Relative tumor sizes of (A). **P < 0.01, compared with control (cancer cells). (C) Fluorescence images for TAMs in tumor area after different treatment as labeled by Blue Dextran®. (D) Relative fluorescence intensity of (C). **P < 0.01 and ***P < 0.001, compared with control (HT1080).

