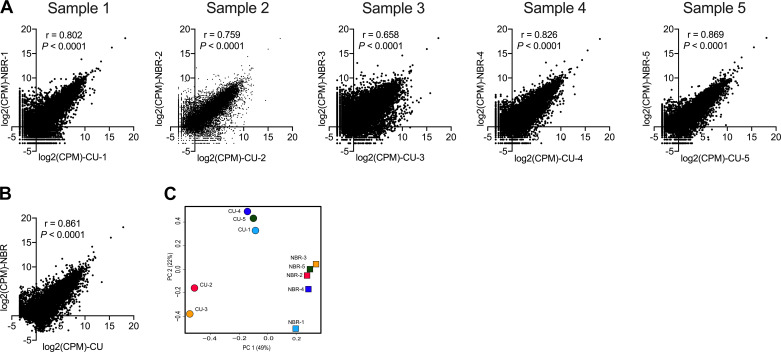
Fig. 1.
Overall gene expression of nasal brushing (NBR) and cultured nasal epithelial (CU) samples. A and B: pair-wise sample (A) and pooled (B) correlation analysis using Pearson’s correlation analysis and log2-transformed count per million reads (CPM) between CU and NBR. C: principal component (PC) analysis of nasal brushing and cultured nasal epithelial cell samples using all genes expressed. Genes that were not expressed in all 5 samples were excluded. P < 0.05 was considered statistically significant.

