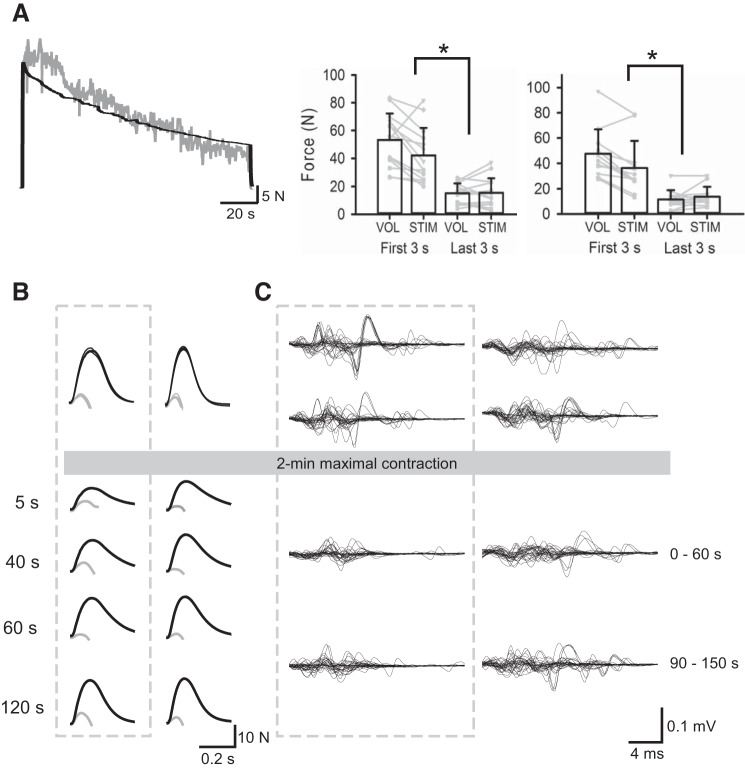
Fig. 2.
A, left: raw force traces from 2-min maximal voluntary (gray line) and electrically stimulated (black line) contractions in the same individual. Right: group mean force of the first and last 3 s of the voluntary (VOL) and electrically stimulated (STIM) maximal contractions for experiment 1 (left, n = 14) and experiment 2 (right, n = 12). Individual data are shown by gray lines. B: superimposed (doublet) (gray lines) and resting (doublet) twitches (black lines) for a single participant before and after the 2-min fatiguing maximal contraction on each day. Twitch responses following the 2-min maximal voluntary contraction (MVC) are shown for 5, 40, 60, and 120 s after the maximal contraction and are enclosed within the gray dotted box. Voluntary activation during the VOL visit was 86% at baseline and 54, 73, 91, and 74% at 5, 40, 60, and 120 s postcontraction, respectively. Voluntary activation during the STIM visit was 86% at baseline and 91, 96, 92, and 92%, respectively, at postcontraction times. C: superimposed traces of 30 F-wave responses in an individual participant before and after the 2-min fatiguing maximal contraction on each day. F-waves are shown without the preceding M-waves. Supramaximal ulnar nerve stimuli were delivered 23 ms before the start of each trace. F-waves obtained before and after the 2-min MVC are enclosed within the gray box. Following the 2-min fatiguing MVC, mean F-wave area was decreased by 45 and 34% compared with baseline values at 0–60 s and 90–150 s. Similarly, F-wave persistence decreased by 27 and 17%, respectively. Following the 2-min fatiguing electrically evoked maximal contraction, F-wave area was unchanged at 0–60 s and increased by 9% at 90–150 s. F-wave persistence increased by 7% at 0–60 s and was unchanged at 90–150 s. *P < 0.05.

