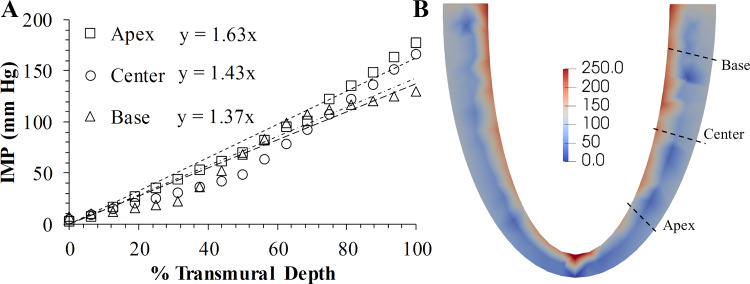
Fig. 5.
A: variation in peak intramyocardial pressure (IMP) across the transmural wall thickness in the base, center, and apex regions of the left ventricle (LV). Start of the x-axis is the epicardium and the end is the endocardium. B: contour plot of IMP distribution in the LV at peak systole has the highest negative (compressive) values in the subendocardium, which decays to nearly zero in the subepicardium. Units of the color bar are in mmHg.

