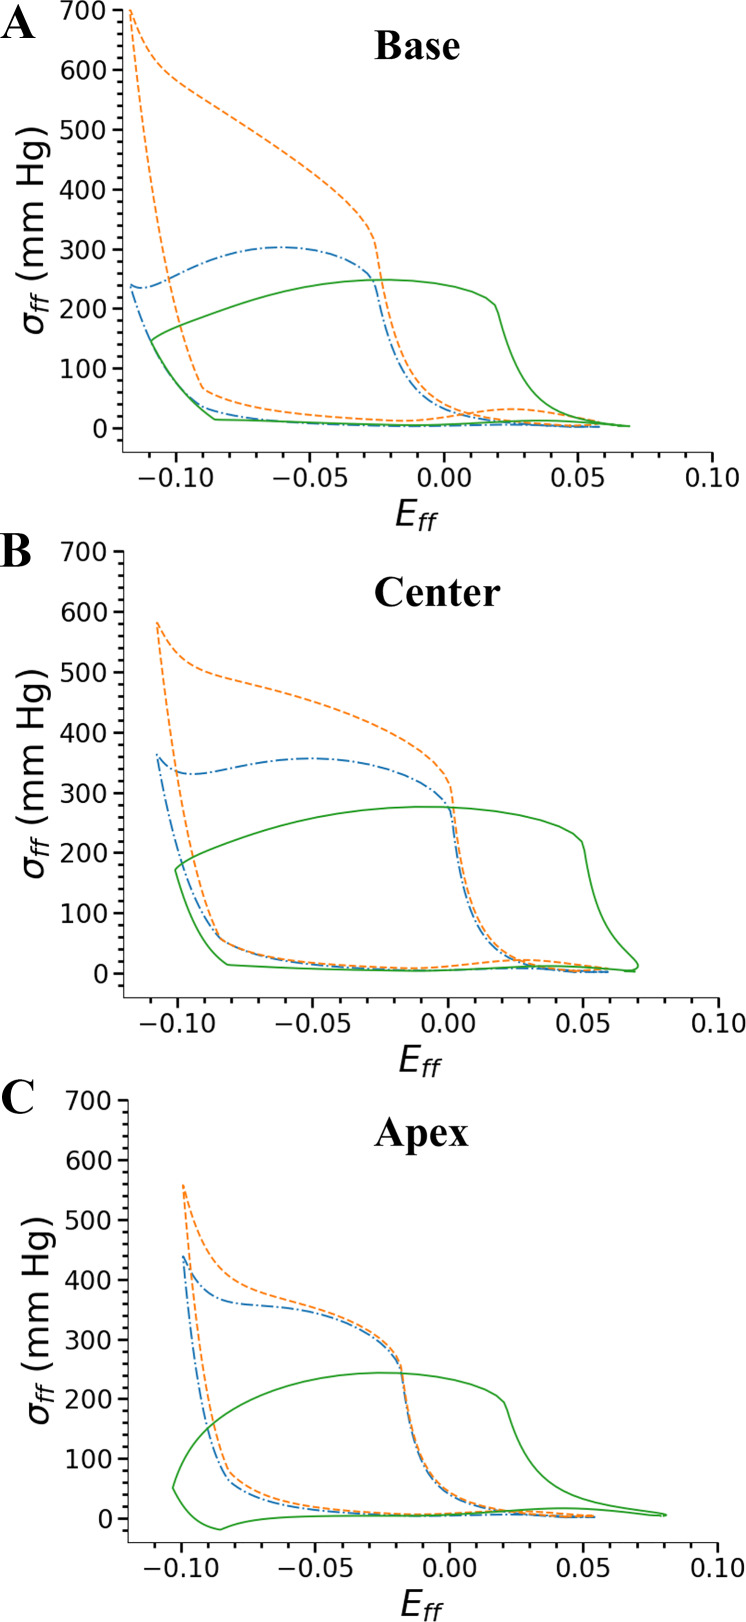
Fig. 7.
Myofiber stress-strain plots at 3 axial left ventricle (LV) positions and 3 transmural regions of base (A), center (B), and apex (C) of the LV and 3 transmural locations of subendocardium (solid line), midwall (dashed line), and subepicardium (dash-dotted line). Regional work done by the myofibers is from the area under the stress-strain curve. Area of the curves in the 3 transmural regions of the apex are lower than that in the base or center region. Eff,, myofiber strain; σff, myofiber stress.

