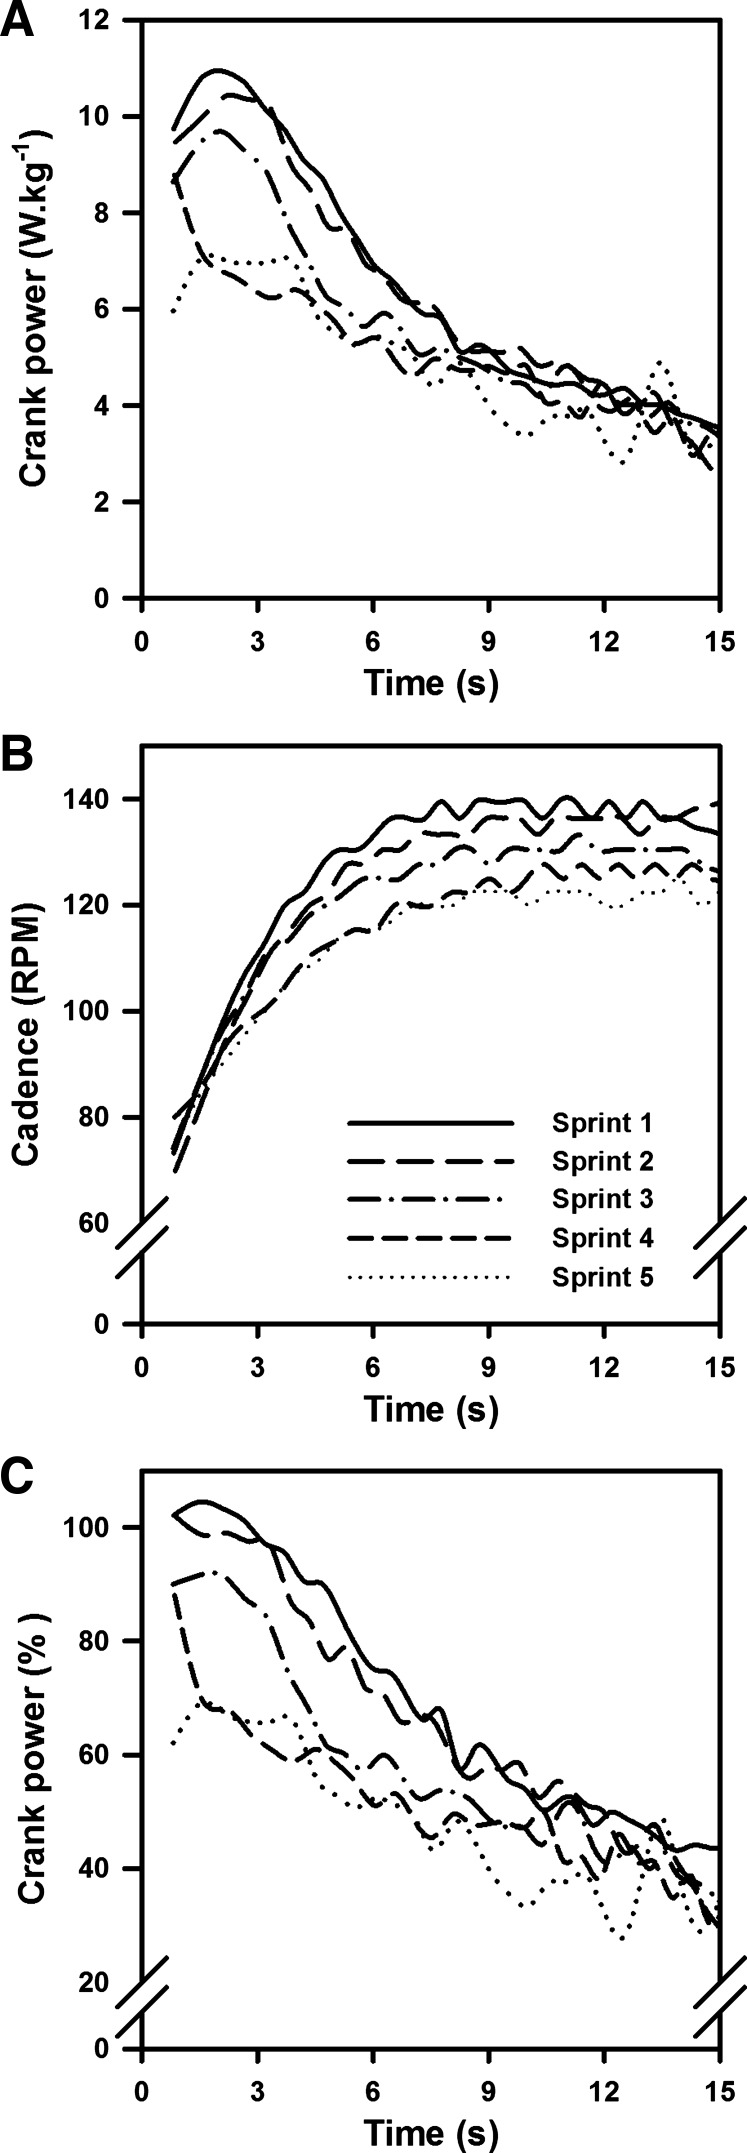
Fig. 1.
Representative changes in power production and cadence measured during each of the five 15-s maximal efforts performed by 1 female participant. A: crank power (expressed in W/kg) increased during the first portion of the maximal bouts before decreasing as participants reached the end of their maximal efforts, whereas a lower average level of power was measured during the last maximal effort compared with the first one. B: cadence increased to a plateau between the start and the end of each maximal effort, whereas lower plateau cadences were reached at the end of the last maximal effort, with cadence changes contributing to the variations in power production seen in A. C: crank power (expressed as %maximal power at the same cadence) decreased during each sprint, whereas successive sprints led to power decreases at the start of the next sprint.

