Figure 1.

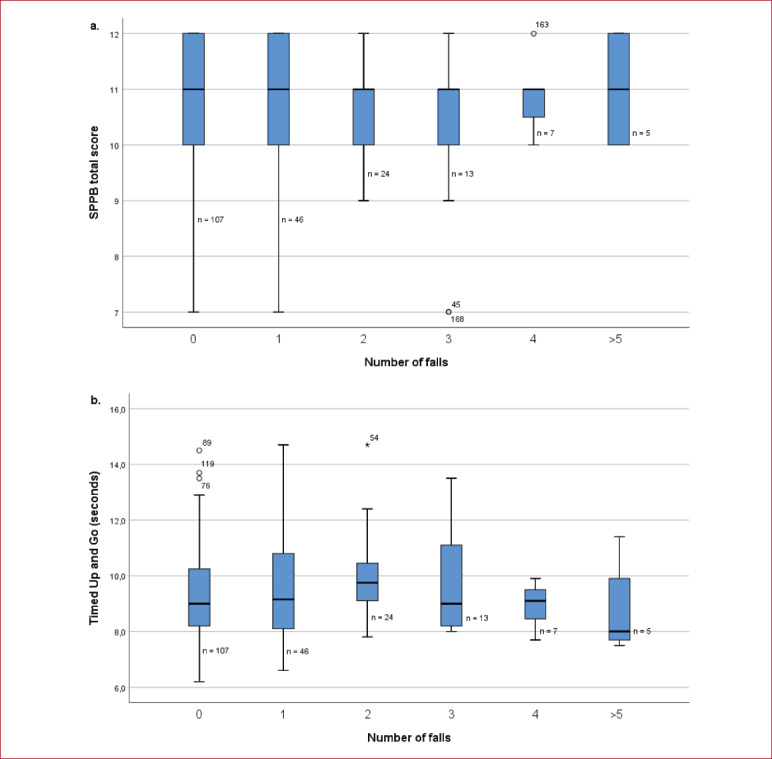
Boxplots representing the distribution of number of falls per person during one year according to test score in a. the Times Up and Go test and b. Short Physical Performance Battery.

Boxplots representing the distribution of number of falls per person during one year according to test score in a. the Times Up and Go test and b. Short Physical Performance Battery.