Figure 2.

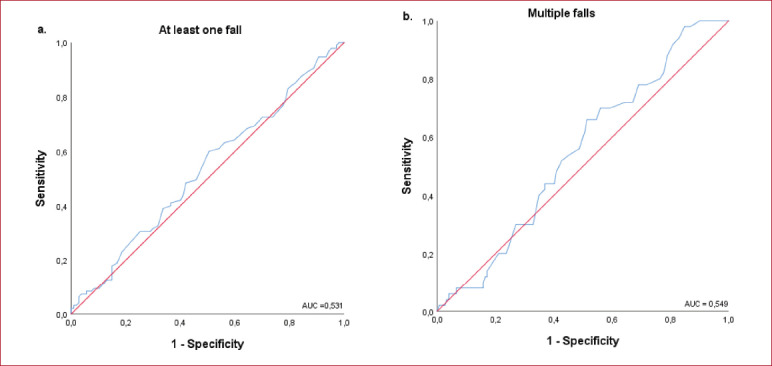
ROC-curves illustrating the predictive validity of the Timed Up and Go test for a. one or more falls compared to no falls and b. two or more falls compared to no or a single fall.

ROC-curves illustrating the predictive validity of the Timed Up and Go test for a. one or more falls compared to no falls and b. two or more falls compared to no or a single fall.