FIGURE 1.
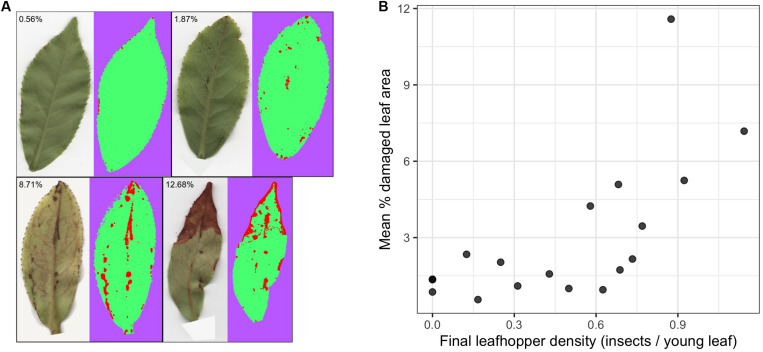
The relationship between leafhopper density and visible leaf damage. (A) Representative leaf images highlighting the range and types of damage with results from WEKA segmentation where red, green, and purple represent pixels that have been classified as damaged, undamaged, and background, respectively. (B) Scatter plots show the relationship between leafhopper density and mean percent leaf damage where each point represents a pot (n = 19). There is a threshold type relationship between leafhopper density and leaf damage.

