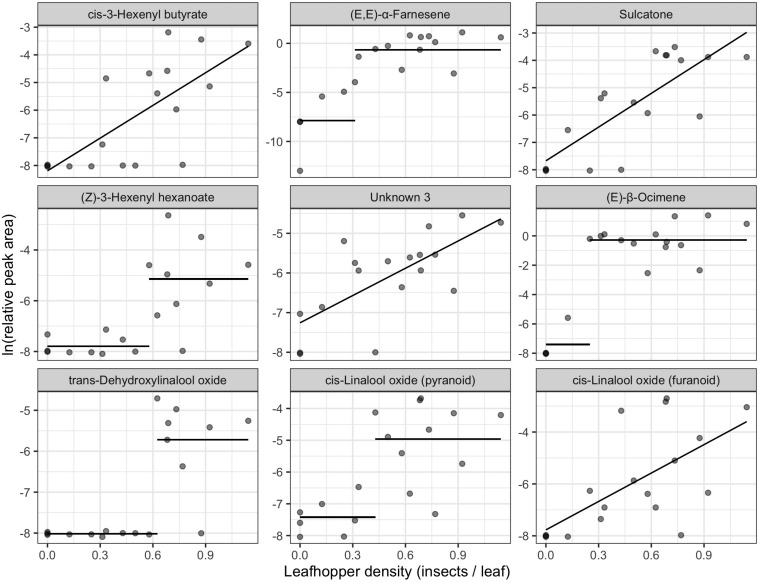
FIGURE 2.
Biomarkers of leafhopper density identified from redundancy analysis of natural log-transformed relative peak areas of compounds detected in tea samples (n = 18). The x-axis represents the number of leafhoppers per young leaf at the end of the feeding period. Panels are in order of correlation to the RDA axis from strongest to weakest going left to right, top to bottom. Lines show fitted values of the winning univariate models. Only the top 9 biomarkers are plotted here. See Table 1 for a full list of biomarkers.

