FIGURE 2.

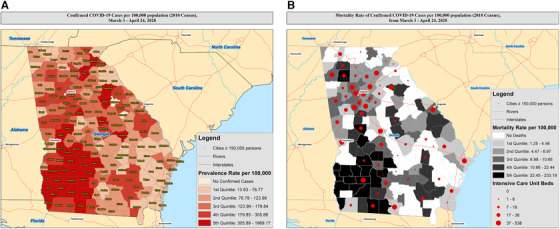
(A) The prevalence of confirmed COVID‐19 cases in Georgia up through April 24, 2020. (B) Mapping of mortality rates per 100,000 population, overlaid with estimated number of available ICU beds

(A) The prevalence of confirmed COVID‐19 cases in Georgia up through April 24, 2020. (B) Mapping of mortality rates per 100,000 population, overlaid with estimated number of available ICU beds