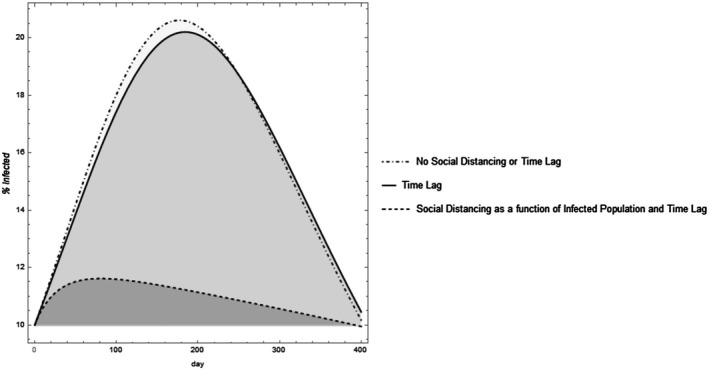
Figure 2.

Varying assumptions can alter the dynamic projection model outcomes. Assuming there is a time lag shifts the curve. Including social distancing that increases with increased infective populations and decreases with declining infected populations “flattens the curve” and results in an asymmetric projection. The parameter values were set with total population set as 1,000 individuals, . For the time lag model, the time lag for infection was set at days and the time lag to mortality at 3 days. For the model where is represented by the Hill function, and .
