
Figure 3.
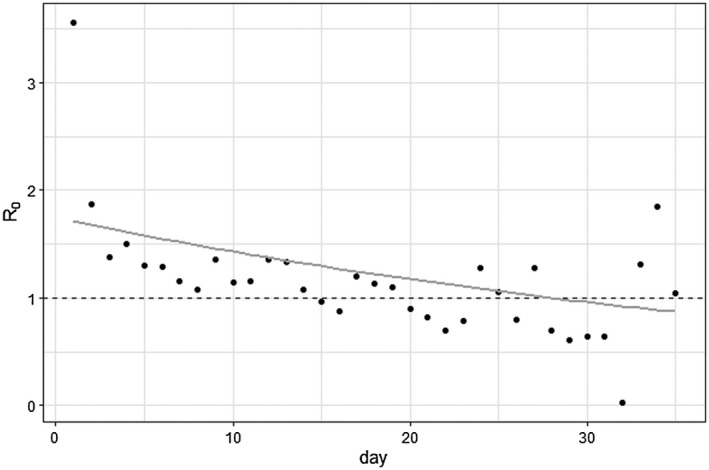
The effective reproduction number , sometimes referred to as or “R naught,” for New York fit to data with an exponential curve. represents the average number of secondary cases because of one infected person at the beginning of the epidemic, and in order for the epidemic to decline, should be less than 1. The points are the calculated daily effective reproduction number calculated by number of observed cases divided by the number of expected cases on a given day, while the gray curve forecasts future effective reproduction numbers that can be used in dynamic projection SIR models. Here, went below 1 (represented by the dashed line) around 28 days.