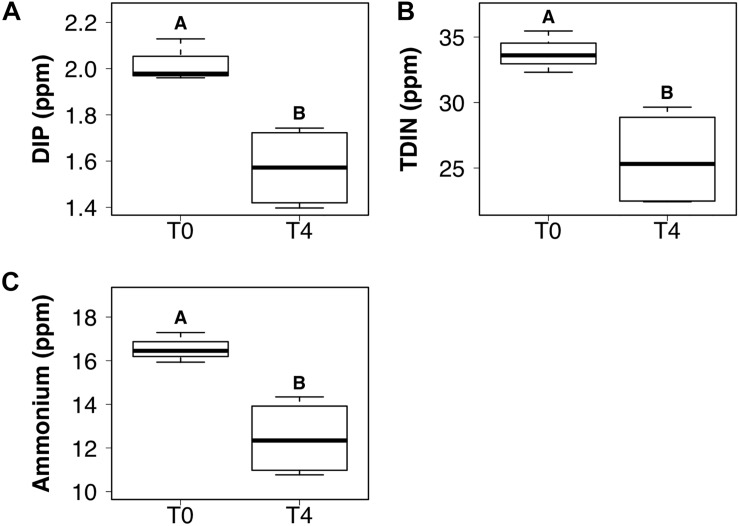
FIGURE 3.
Boxplots showing the median, upper and lower interquartile range of dissolved inorganic phosphorus (DIP) (A), total dissolved inorganic nitrogen (TDIN) (B) and ammonium (C) concentrations for the combined DIP and dissolved inorganic nitrogen (DIN) treatment at the initial (T0) and final (T4) time points. Uppercase letters denote homogeneous subsets derived from post hoc Tukey HSD analysis on a significant two-way ANOVA in relation to the time point and treatment.

