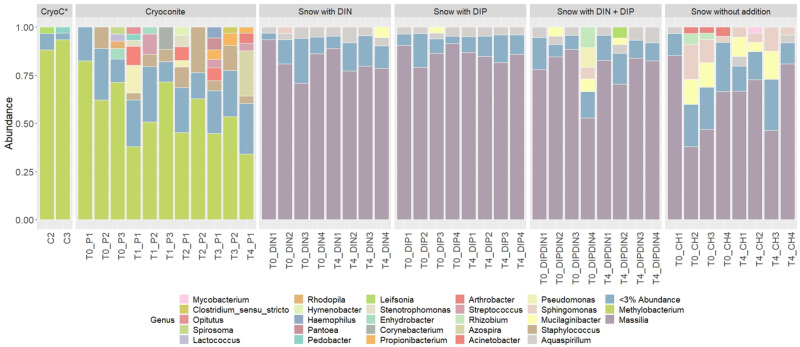
FIGURE 6.
Relative abundances of taxa representing > 5% abundance and classified to genus level across all treatments and time points. CryoC* represents untreated, furnaced cryoconite control, with C2 and C3 representing the two replicates. T0–T4 represent time points 0–4, respectively. DIN and DIP represent dissolved inorganic nitrogen and dissolved inorganic phosphorus, respectively. P/DIN/DIP/DIPDIN/CH 1–4 represent the four replicates for each time point per treatment.

