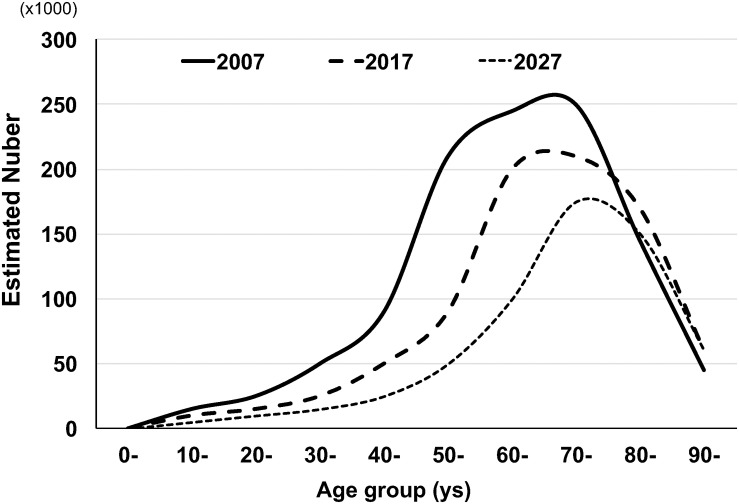
FIGURE 1.
Possible changes of estimated numbers of HTLV-1 carriers in Japan by age group. The figure was modified from Figures 3 and 5 in the article by Satake et al. (2012). The age-specific estimated numbers of HTLV-1 carriers in 2007 were determined by multiplying the age-specific HTLV-1 positive rate of blood donors in 2007 by the age-specific general population. The age-specific estimated numbers of HTLV-1 carriers in 2017 were also obtained by Satake et al. Based on the change in the age-specific estimated numbers of HTLV-1 carriers between 2007 and 2017, Satake et al. estimated the future (2027) age-distribution of age-specific HTLV-1 carriers.

