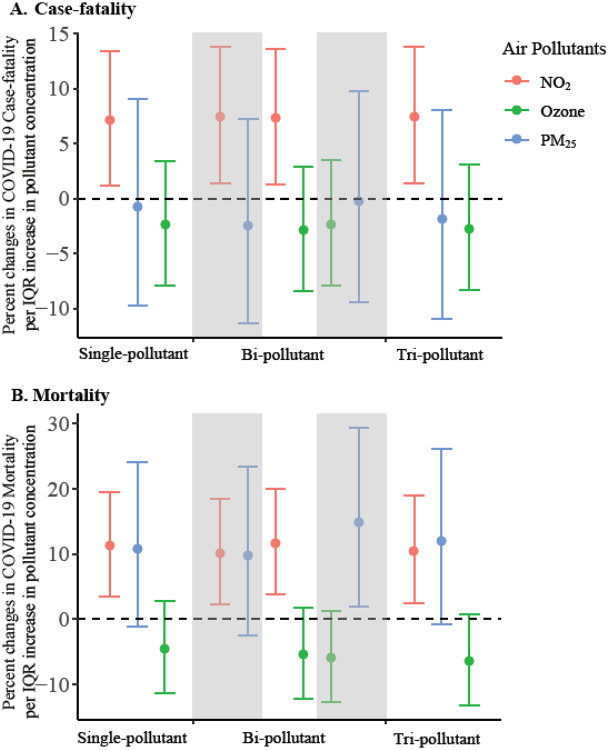
Figure 3. Percent Change in County-level COVID-19 Case-fatality Rate (A) and Mortality Rate (B) Per Inter Quartile Range (IQR) increase in Long-Term Air Pollutant Concentrations.
Effect estimates and 95% confidence interval were calculated using county-level concentrations of nitrogen dioxide (NO2, red), ozone (green), and fine particulate matter (PM2.5, blue) averaged between 2010–2016, controlling for covariates including county-level number of case per 1000 people, social deprivation index, population density, percent of residents over 60 years old, percent of male, body mass index, smoking rate, number of regular hospital beds per 1000 people, number of intensive units beds per 1000 people, number of medical doctors per 1000 people, average mobility index assessed in March and April 2020, average temperature and humidity between January 22 to April 29, 2020, state-level COVID-19 test positive rate as of April 29, 2020, and spatial smoother with a degree freedom of 5 for both latitude and longitude. IQRs of NO2, PM2.5, and O3 averaged between 2010–2016 were 4.6 parts per billion (ppb), 3.4 ug/m3, and 2.8 ppb, respectively.

