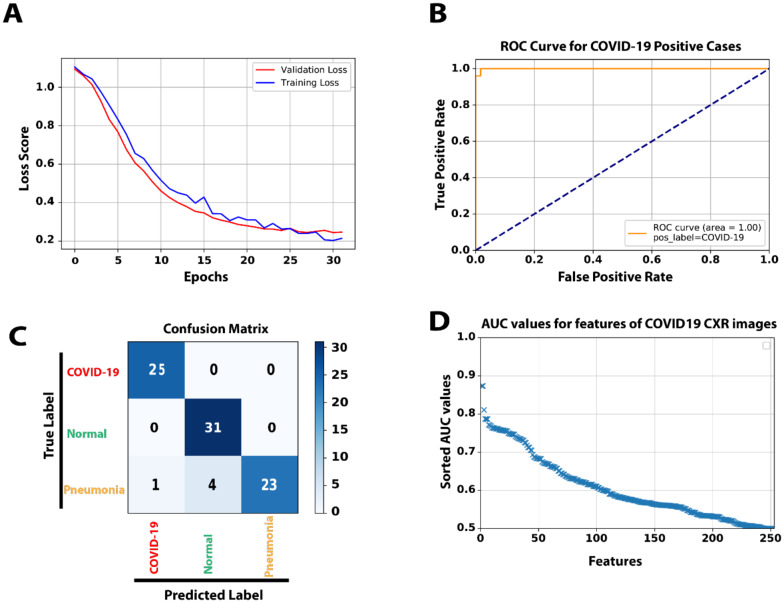
Figure 3:
A) The loss score graph of the training and validation sets during the model training process. B) The ROC curve generated from 84 test samples, while COVID-19 is the target class. C) The Confusion matrix of predicting 84 test samples in three categories. D) To compares and analyze the discrimination power of different single features among the original 252 extracted features, we used AUC values as an indicator. All features were sorted in the order of their AUC values.

