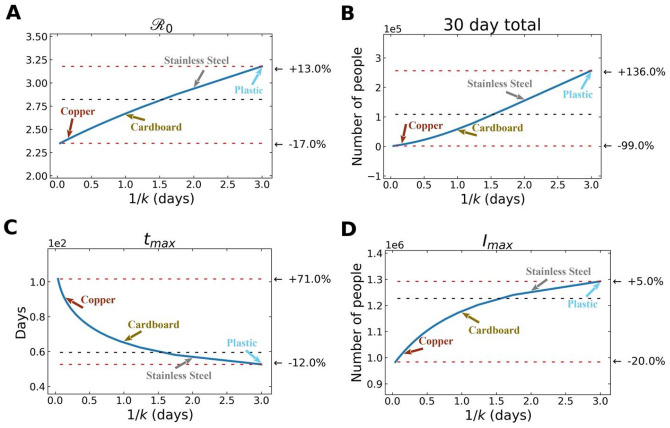
Figure 5.
Various features of an outbreak change as a function of 1/k (where k is the rate of decay of SARS-CoV-2 survival in the environmental compartment): to (A) , (B) total number of infected (and symptomatic) after 30 days of outbreak, (C) time to peak number of symptomatic individuals (tmax), and (D) peak number of symptomatic individuals. The black dashed lines show the value of the respective plotted value at the average value of 1/k (~ 1.5 days), used in the fits from above. The top red line shows the maximum of plotted value for either the smallest value of 1/k chosen ( = 1 hr) or the largest value of 1/k chosen ( = 3 days), depending on whether the plotted value decreases or increases with 1/k, and the bottom red line shows the plotted value at the other extreme of 1/k.

