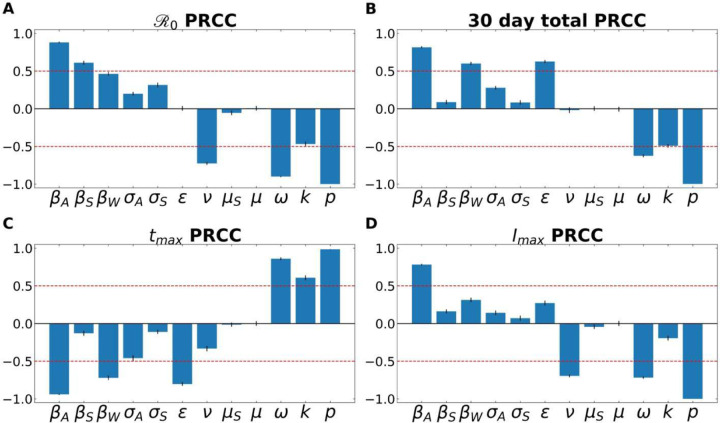
Figure 3.
A Partial Rank Correlation Coefficient (PRCC) sensitivity analysis was performed with respect to (A) , (B) total number of infected (and symptomatic) after 30 days of outbreak, (C) time to peak number of symptomatic individuals (tmax), and (D) peak number of symptomatic individuals. This analysis highlights the intercorrelated sensitivities of each of the model parameters. The blue bars show the mean value of each PRCC, with error bars at one standard deviation. This analysis was performed by sampling over uniform distributions of 4.5% around the nominal model parameter values. Parameters correspond to the fixed ones in Table 3, and the average fitted parameters values in Table S5. The red line marks PRCC values of +/− 0.50 and helps identify parameters that are more influential (greater than 0.50 or less than - 0.50). See Supplemental Information for more details.

