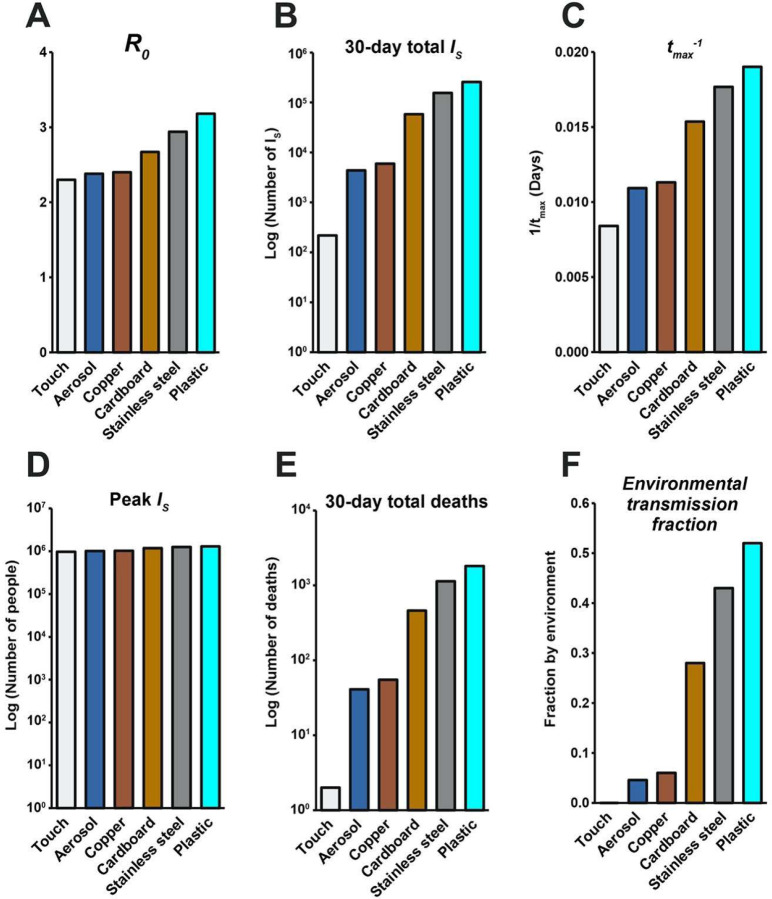
Figure 7. Summary of the “surface world” outbreak intensity measures.
Graphs correspond to the attributes of simulated epidemics where environments are entirely composed of a given physical surface, and larger values correspond to various aspects of outbreak intensity. A) , (B) total number of infected (and symptomatic) after 30 days of outbreak, (C) the inverse time to peak number of symptomatic individuals (tmax−1; larger values = shorter times to reach peak), (D) peak number of symptomatic individuals, (E) deaths after 30 days, and (F) environmental transmission fraction. Note the log scales on the y-axis in (B), (D) and (E).

