
Fig. 5. Hypothetical “reservoir world” simulations feature differing environmental transmission dynamics.
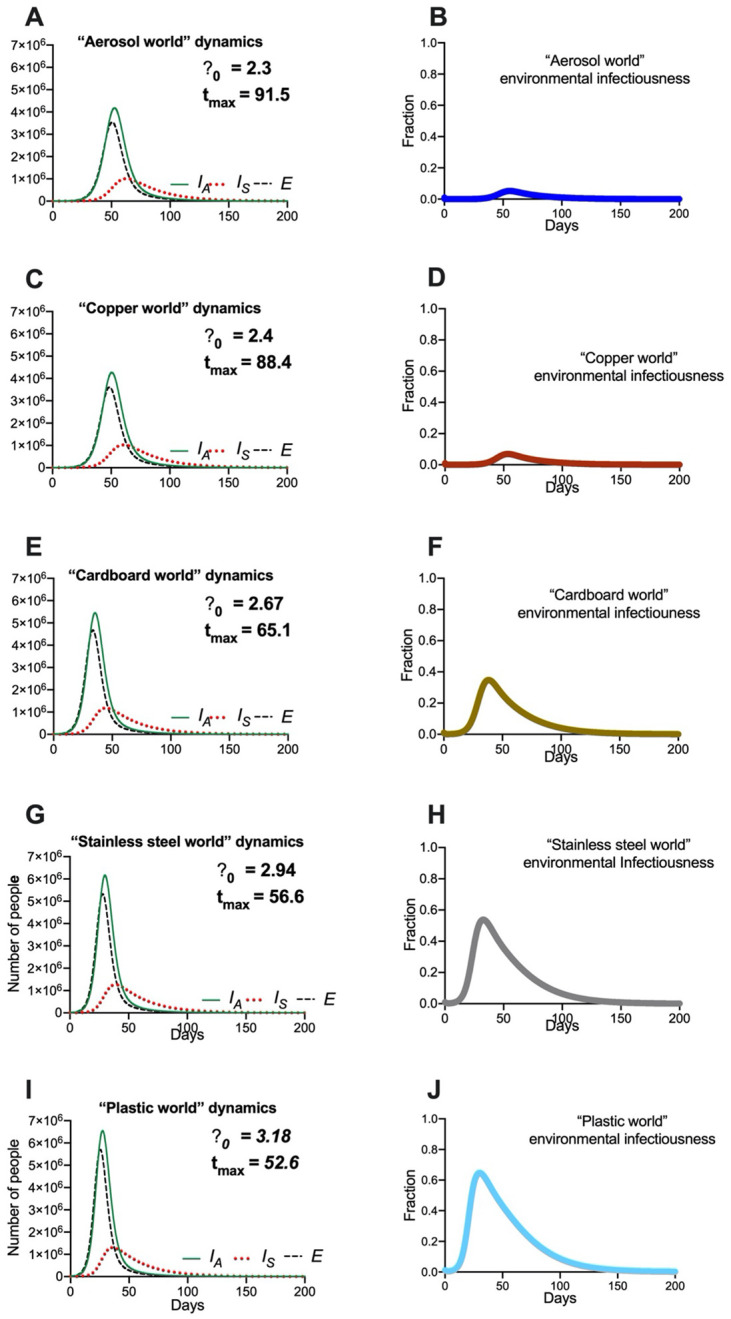
Population and environmental dynamics of SEIR-W model outbreaks in hypothetical settings composed of pure substances where SARS-CoV-2 can survive and be transmitted. (A, B) “aerosol world,” (C, D) “copper world,” “ (E, F) cardboard world,” (G, H) “stainless steel world,” and (I, J) “plastic world.” Environment infectiousness corresponds to the proportion of the environment that contains infectious SARS-CoV-2. Note that the surface where the viral decay is strongest (Copper), the peak of the epidemic is pushed farthest from the origin. Also note the values graphs A, C, E, and G, which highlight that the different “reservoir worlds” behave like fundamentally different outbreaks in several ways.