
Figure 1:
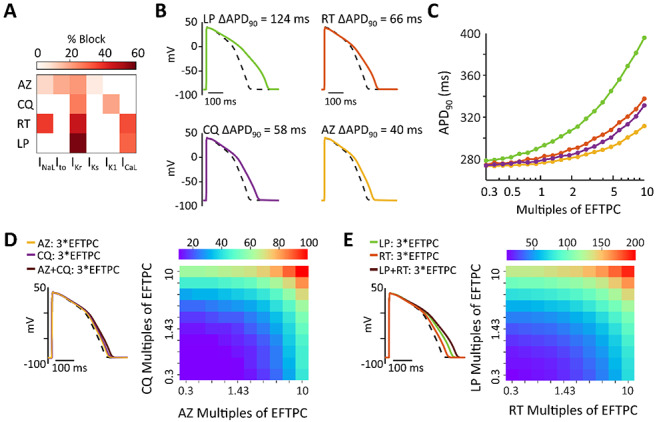
(A) Heatmap illustrating the extent to which azithromycin (AZ), chloroquine (CQ), ritonavir (RT), and lopinavir (LP) inhibit 6 important cardiac ionic currents, as previously measured.12 Reference 11 reported effective free therapeutic plasma concentration (EFTPC) of each drug, in addition to IC50 values that indicated how much each drug influenced 6 cardiac ionic currents (see Methods for abbreviations). Block of currents by particular drugs at 10*EFTPC was calculated based on drug concentration and IC50 values using a simple pore block model. (B) Simulations with the baseline myocyte model demonstrating how each simulated at 10*EFTPC are predicted to influence ventricular action potentials (APs). (C) Concentration-response curves illustrating how the 4 drugs influence APD90, the duration between the action potential upstroke (maximal rate of change of voltage) and 90% repolarization. Drug concentrations tested ranged from 0.3 times to 10 times EFTPC, with logarithmically-spaced increments. (D) Predicted AP prolongation (ΔAPD90) for chloroquine + azithromycin. (E) Predicted ΔAPD90 for lopinavir + ritonavir. Combination therapy causes greater AP prolongation than drugs applied individually, as shown in both heatmaps illustrating ΔAPD90 over a range of drug concentrations, and in example AP traces showing effects at 3*EFTPC.