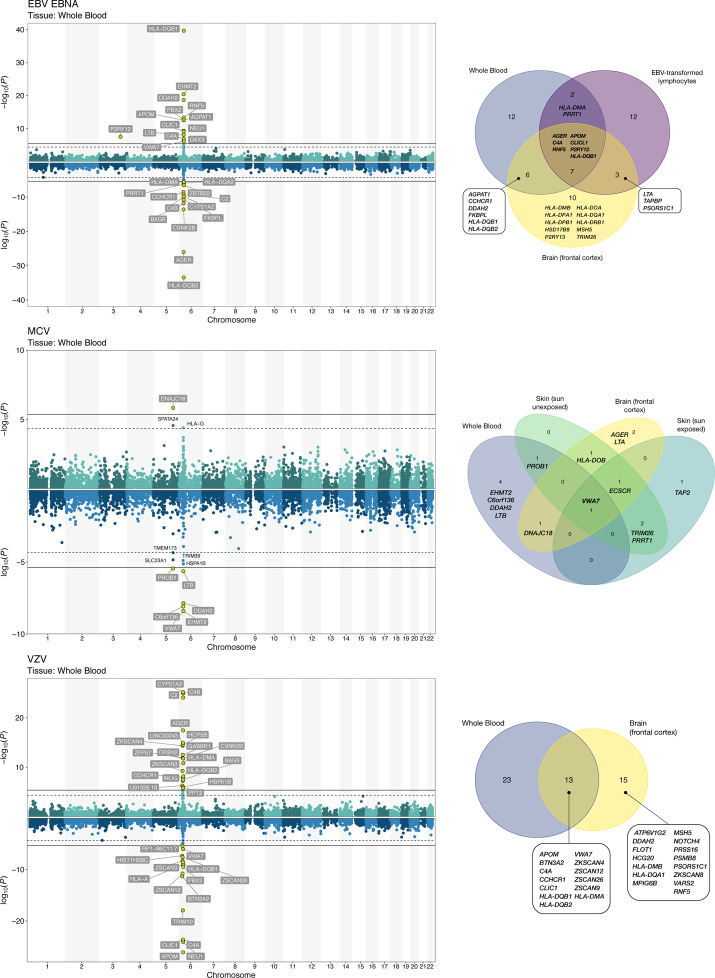
Figure 4:
TWAS associations with continuous antigen response phenotypes. Two Manhattan plots depicting the transcriptome-wide associations for genes with a positive direction of effect (increased expression leads to higher antibody response) and genes with a negative direction of effect (increased expression is associated with a reduced antibody response).

