Fig. 1.
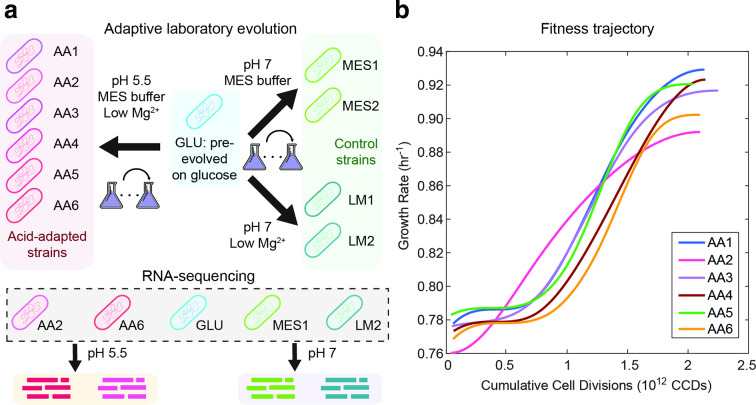
ALE of E. coli under acid stress. (a) Schematic of the ALE process and strains used for RNA-seq. Starting from the GLU strain, we performed ALE at pH 5.5 to obtain six acid-adapted (AA) strains and at pH 7 to obtain four control strains. Two control strains were adapted in glucose minimal medium with lowered magnesium concentration (LM) and two control strains were adapted in glucose minmal medium with MES buffer (MES). Using RNA-seq, we obtained the gene expression profiles of five selected strains at pH 5.5 and 7. (b) Smoothed fitness trajectories of six acid-adapted strains (raw data in Fig. S1). Raw data for the fitness change of the control strains can be found in Fig. S2. We show here the change in growth rate over cumulative cell divisions through the evolution process. The average growth rate improvement is 18 %.

