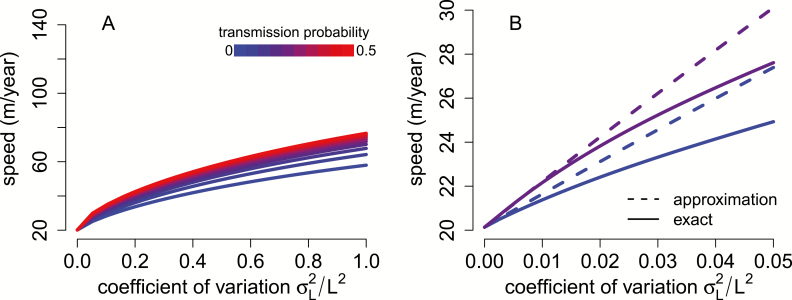
Figure 2.
Individual variation in dispersal rates increases rate of spatial spread. In (A), rates of spatial spread for Acer rubrum (see Model and Methods) are plotted against the coefficient of variation of the dispersal rate and for increasing probabilities of perfect transmission (from blue to red). In (B), the analytical approximations (dashed lines) provide a good approximation to the exact invasion speeds (solid lines) for low variability and transmission probabilities. Higher levels of variation (A) have a decelerating effect on rates of spatial spread.

