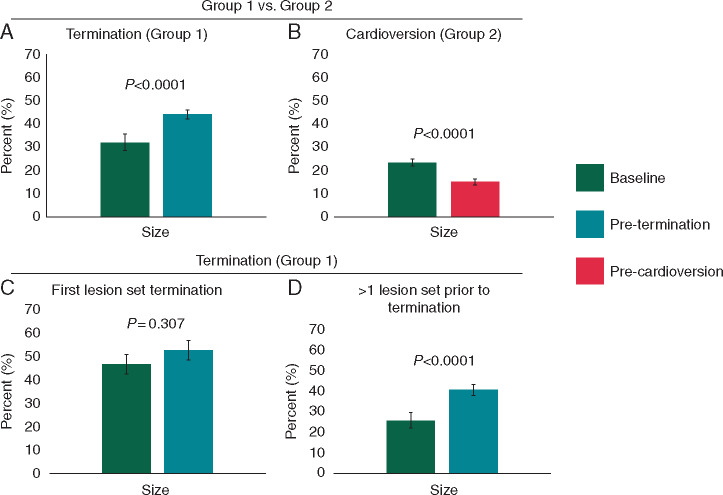
Figure 6.
Temporal progression of organized areas during ablation in both groups. (A) Bar graph showing organized area size of the terminating site in Group 1 at two different time points: at baseline AF (dark green) and prior to termination (green). (B) Comparison of organized area size at baseline AF (dark green) and prior to cardioversion (red) in Group 2. (C) In patients that had acute termination of AF with first lesion set, comparison of organized area of terminating site at both baseline AF (dark green) and prior to termination (green). (D) In patients receiving more than one ablation prior to termination of AF, comparison of organized area size of termination site at both baseline AF and prior to termination. Error bars represent standard error of means. AF, atrial fibrillation.

