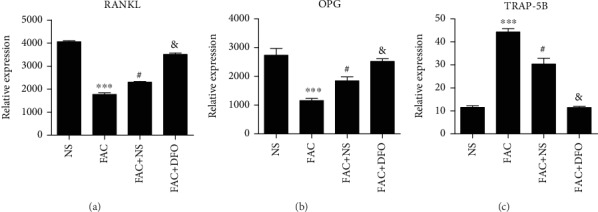
Figure 3.

The serum expression levels of RANKL, OPG, and TRAP-5B. ELISA measured the serum expression levels of the two bone formation markers, RANKL (a) and OPG (b), and the bone resorption marker, TRAP-5B (c), which were compared between the four groups of rat bipedal walking models (RBWM). The asterisk (∗), pound sign (#), and ampersand (&) indicated the statistical significance of the comparisons for FAC vs. NS, FAC+NS vs. FAC, and FAC+DFO vs. FAC, respectively. One symbol refers to P < 0.05, two symbols refer to P < 0.01, and three symbols refer to P < 0.001.
