Figure 5.

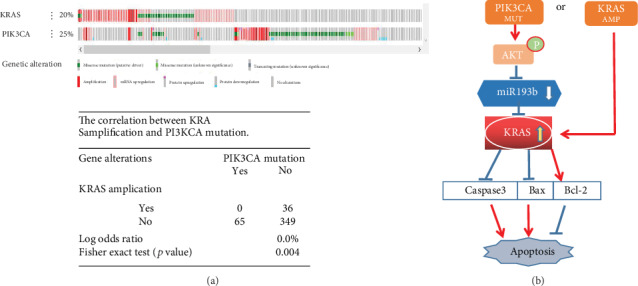
(a) KRAS amplification and PI3KCA mutation show mutual exclusion. (b) Schematic diagram of the pAkt-miR193b-KRAS pathway. ∗p < 0.05 and ∗∗p < 0.01 were calculated using Student's t-test.

(a) KRAS amplification and PI3KCA mutation show mutual exclusion. (b) Schematic diagram of the pAkt-miR193b-KRAS pathway. ∗p < 0.05 and ∗∗p < 0.01 were calculated using Student's t-test.