
Figure 5.
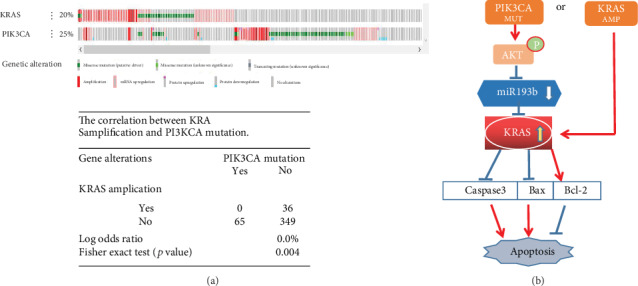
(a) KRAS amplification and PI3KCA mutation show mutual exclusion. (b) Schematic diagram of the pAkt-miR193b-KRAS pathway. ∗p < 0.05 and ∗∗p < 0.01 were calculated using Student's t-test.
Official websites use .gov
A
.gov website belongs to an official
government organization in the United States.
Secure .gov websites use HTTPS
A lock (
) or https:// means you've safely
connected to the .gov website. Share sensitive
information only on official, secure websites.
(a) KRAS amplification and PI3KCA mutation show mutual exclusion. (b) Schematic diagram of the pAkt-miR193b-KRAS pathway. ∗p < 0.05 and ∗∗p < 0.01 were calculated using Student's t-test.