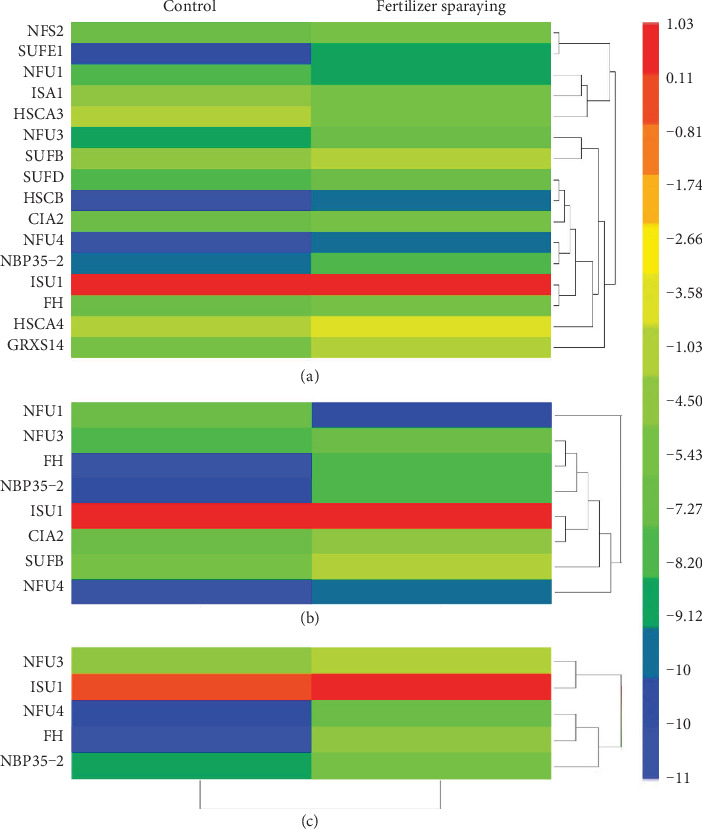
Figure 4.

Induced expression of Fe-S cluster biosynthesis genes in the leaves sprayed with compound amino acid-Fe fertilizer. (a) Gene expression in the leaves collected at stage S2 on April 10th, 2018. (b) Gene expression in the leaves collected at stage S3 on July 10th, 2018. (c) Gene expression in the leaves collected at stage S4 on October 15th, 2018. The relative expression level of genes was presented after normalization to the internal control Ubiquitin and calculated using a log2 scale. The heatmap was plotted using HemI software according to the method described by Deng et al. [30]. The red and blue boxes indicate the high and low expression levels, respectively.
