
Figure 3.
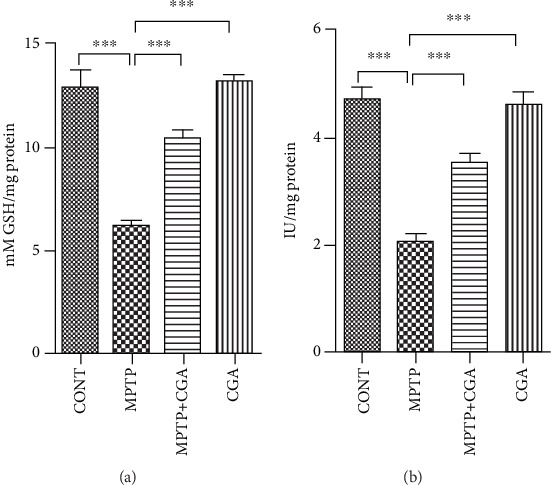
Alterations in mitochondrial antioxidant defence in respective treatment groups. (a) Mitochondrial reduced glutathione level. (b) Mitochondrial superoxide dismutase level. Values are represented in the form of mean ± SEM (n = 5). ∗p < 0.05, ∗∗p < 0.01, and ∗∗∗p < 0.001. Results were studied using the one-way ANOVA and further using the Newman-Keuls test.