
Figure 7.
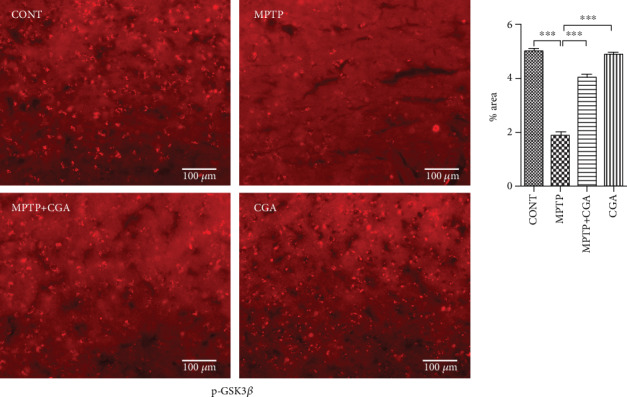
Immunohistochemical staining to analyse the expression of p-ERK1/2 in SN of different experimental groups. Upregulated expression of p-ERK1/2 due to CGA administration in parkinsonian mice (20x). Values are represented as mean ± SEM (n = 5). ∗p < 0.05, ∗∗p < 0.01, and ∗∗∗p < 0.001. Results were studied using the one-way ANOVA and further by the Newman-Keuls test.