Figure 2.

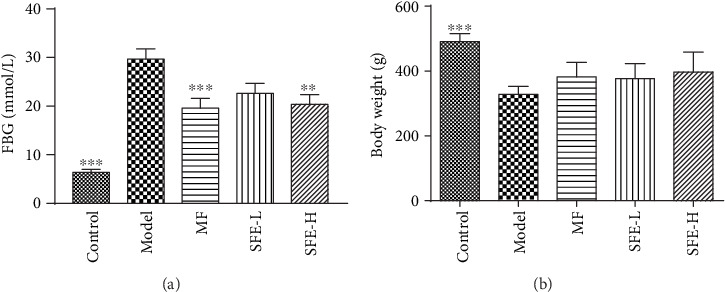
Effects of SFE on FBG levels (a) and BW (b) after 8 weeks of treatment (n = 12). ∗ indicates a significant difference compared with the model group: ∗∗p < 0.01; ∗∗∗p < 0.001.

Effects of SFE on FBG levels (a) and BW (b) after 8 weeks of treatment (n = 12). ∗ indicates a significant difference compared with the model group: ∗∗p < 0.01; ∗∗∗p < 0.001.