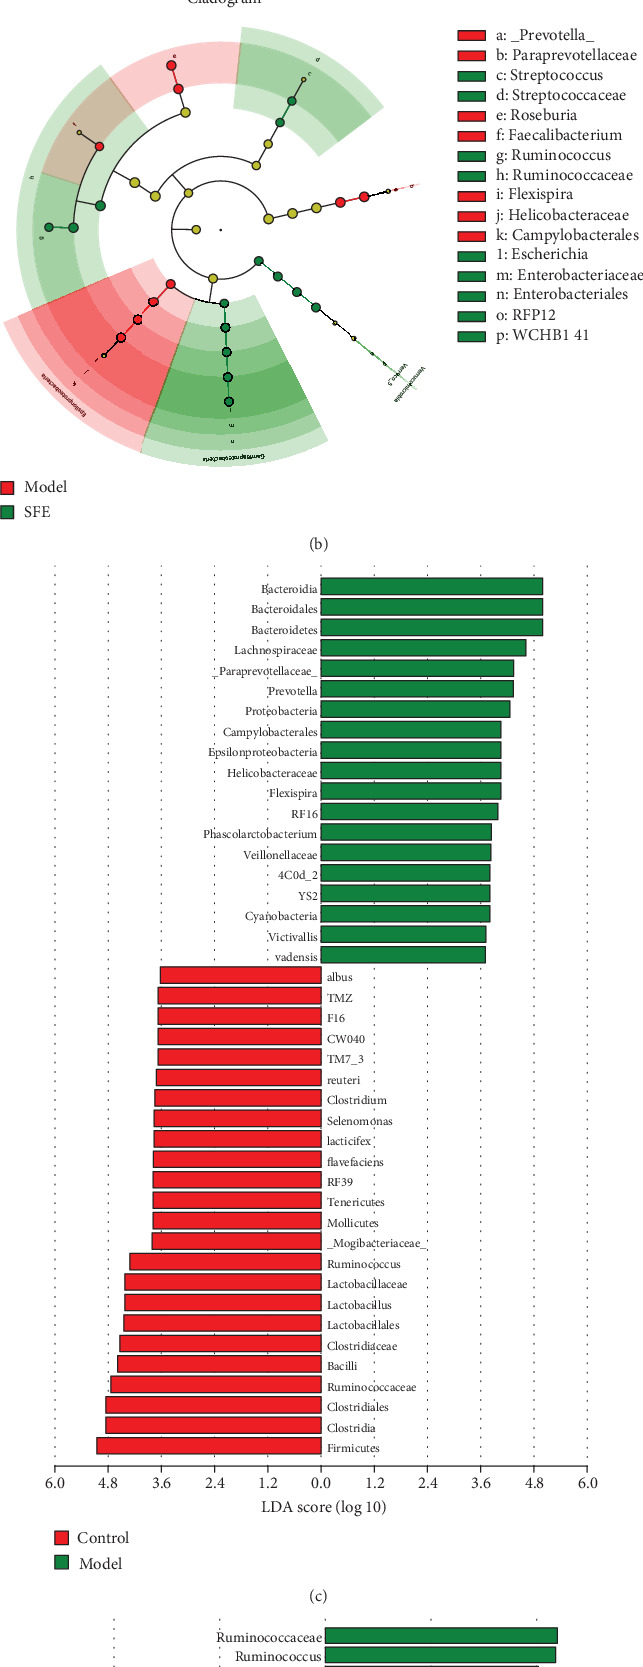
Figure 5.

Markedly changed gut bacteria in response to the T2DM and SFE treatments. (a) Cladogram generated by the LEfSe analysis showing discriminative taxa in the eighth week of feces from the control and T2DM groups. (b) Cladogram generated by the LEfSe analysis showing discriminative taxa in the eighth week of feces from the T2DM and SFE groups. (c) LDA scores of discriminative taxa shown in (a). (d) LDA scores of discriminative taxa shown in (b).
