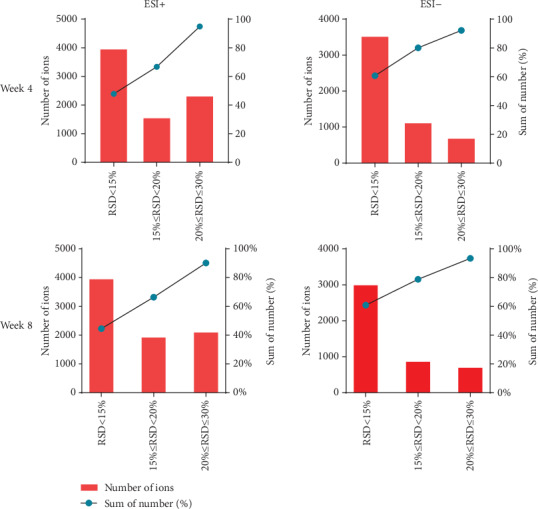
Figure 8.

The distribution of RSD in QC samples under positive ion and negative ion modes in the fourth and eighth weeks. The histogram represents the number of compounds in the specified RSD range, and the line graph represents the cumulative percentage of compounds less than the specified RSD.
