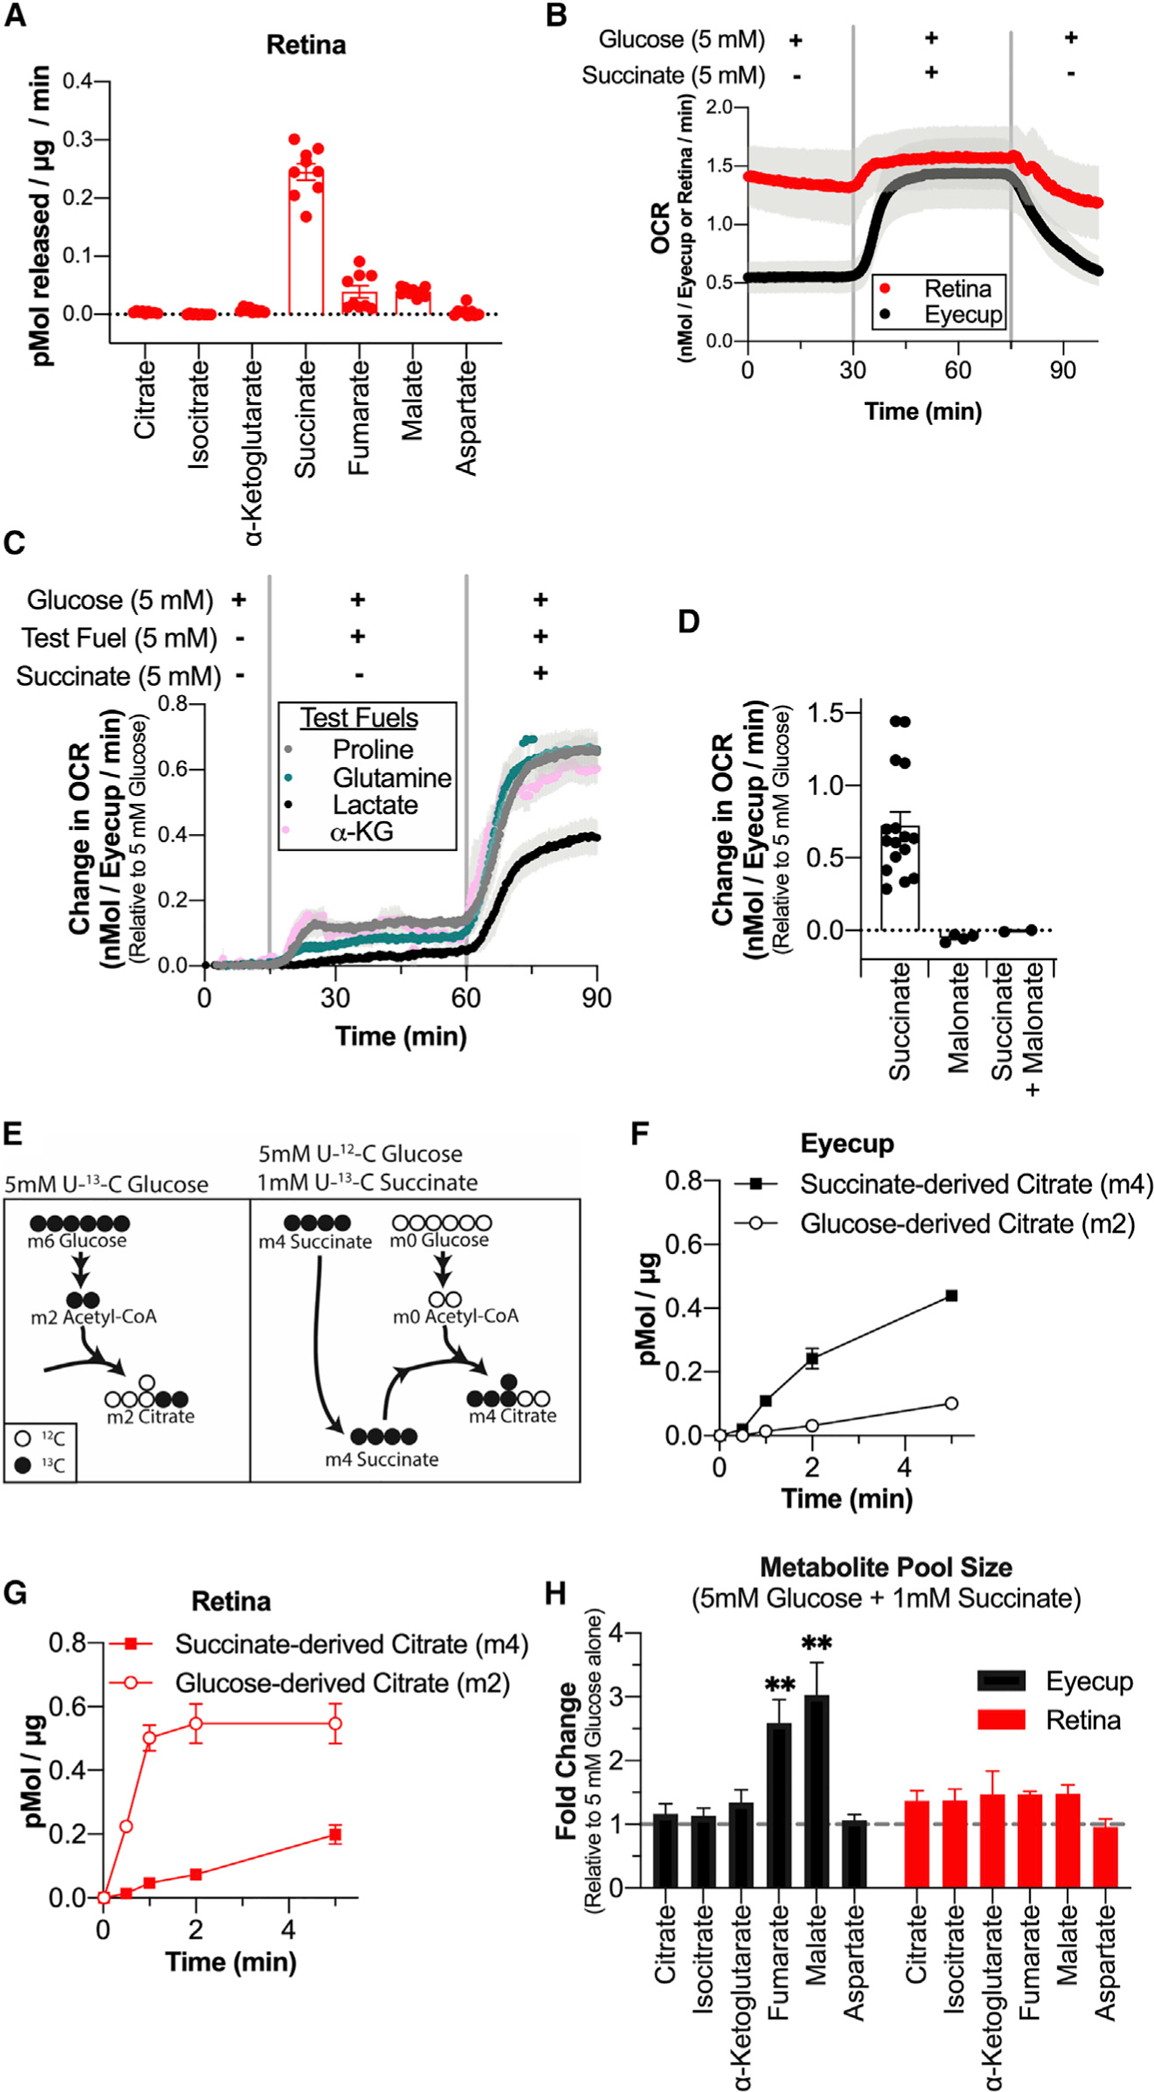
Figure 1. Retinas Release Succinate, which Can Fuel O2 Consumption in Eyecups.

(A) Rate of TCA cycle metabolite release by retinas incubated in 5 mM 12C-glucose. Media samples were taken at 30, 60, and 90 min (n = 9 retinas, 3 per time point; error bars indicate SEM). (B) O2 consumption trace from retinas and eyecups perifused with media containing 5 mM glucose, then 5 mM glucose + 5 mM succinate, and then 5 mM glucose. Vertical gray bars indicate the approximate time when media containing the new metabolite condition reached the tissue (n = 4 retina and 4 eyecup chambers; error bars indicate SEM). (C) O2 consumption trace of eyecups supplied with 5 mM glucose, then 5 mM glucose + 5 mM of a test metabolite, and then 5 mM glucose + 5 mM test metabolite + 5 mM succinate. Test metabolites are proline (gray), glutamine (teal), lactate (black), and α-ketoglutarate (pink) (n = 3 eyecup chambers per condition; error bars indicate SEM). (D) Change in OCR (relative to 5 mM glucose alone) for eyecups supplied with 5 mM glucose + 5 mM succinate, 5 mM glucose + 20 mM malonate, or 5 mM glucose + 20 mM malonate + 5 mM succinate (n = 4 eyecup chambers for malonate and 2 eyecup chambers for malonate + succinate; error bars indicate SEM). (E) Labeling schematic showing isotopomers of citrate produced by U-13C-glucose alone (left) or 12C-glucose + U-13C-succinate (right). (F) Citrate production in eyecups supplied with 5 mM U-13C-glucose alone or 5 mM 12C-glucose + 1 mM U-13C-succinate (n = 2 eyecups per time point; error bars indicate SEM). (G) Citrate production in retinas supplied with 5 mM U-13C-glucose alone or 5 mM 12C-glucose + 1 mM U-13C-succinate (n = 2 retinas per time point; error bars indicate SEM). (H) Pool size of TCA cycle metabolites in eyecups and retinas supplied with 5 mM 12C-glucose + 1 mM U-13C-succinate for 10 min relative to tissue supplied with 5 mM 12C-glucose alone (n = 2 retinas or eyecups; error bars indicate SEM; ** indicates p < 0.005 using Welch’s t test).
