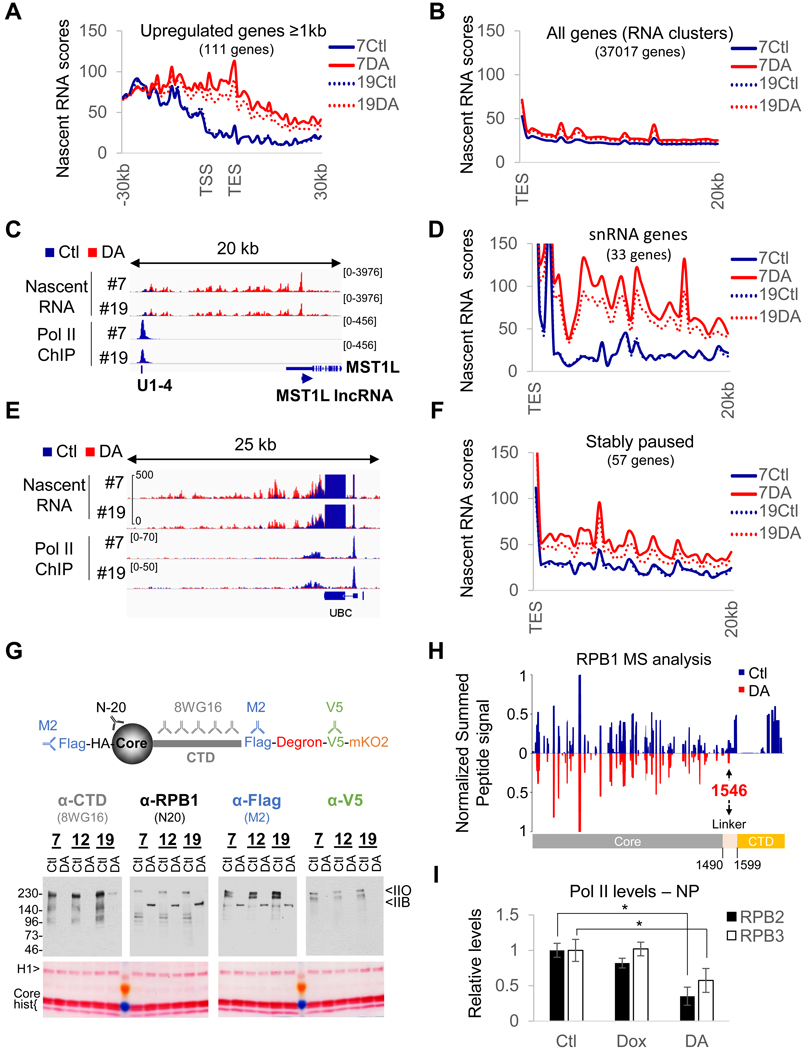
Figure 2. DA-treatment converts a fraction of initiated Pol II into termination-incompetent Pol IIB.
(A) Profile of nascent RNA scores at Pol II genes > lkb upregulated in the microarray analysis in RPBl- expressing (Ctl) or RPBl-depleted (DA) cells for clones #7 and 19#. TSS, transcription start site. TES, transcription end site. (B) Same as (A) but genome-wide profile (all RefSeq RNA clusters) of nascent RNA scores downstream of TES. (C) Overlays of normalized nascent RNA and input-subtracted RPB3 coverage at the MST1L IncRNA locus (anti-sense of MST1L), showing termination site read-through from the upstream snRNA Ul-4 gene in DA treated clone #7 and #19. (D) Same as (B) but profile of nascent RNA scores downstream of all snRNA genes. (E) same as (C) at and downstream of the stably paused UBC gene showing termination site read-through for DA-treated clones #7 and #19 cells. (F) same as (B) but profiles of nascent RNA scores downstream of stably paused genes. (G) Schematic representation of tagged RPB1 protein and the different antibodies used to evaluate RPB1 degradation efficiency and immunoblot and corresponding Ponceau-stained membrane of chromatin pellets prepared from DA-treated and control cells. (H) Mirror plot presenting the summed extracted areas of peptides obtained from full length (Ctl, blue) and truncated RBP1 (DA, red) normalized to the signal at residue 365–382. Note that the peptides covering the perfect heptad repeats (1615–1804) are not included because two peptides could match multiple regions. (I) Quantification of the levels of Pol II subunit expression in nuclear extracts and chromatin pellets (see Figure S2C). Data represent the average +/− SD; *p<0.05 (T-test).

