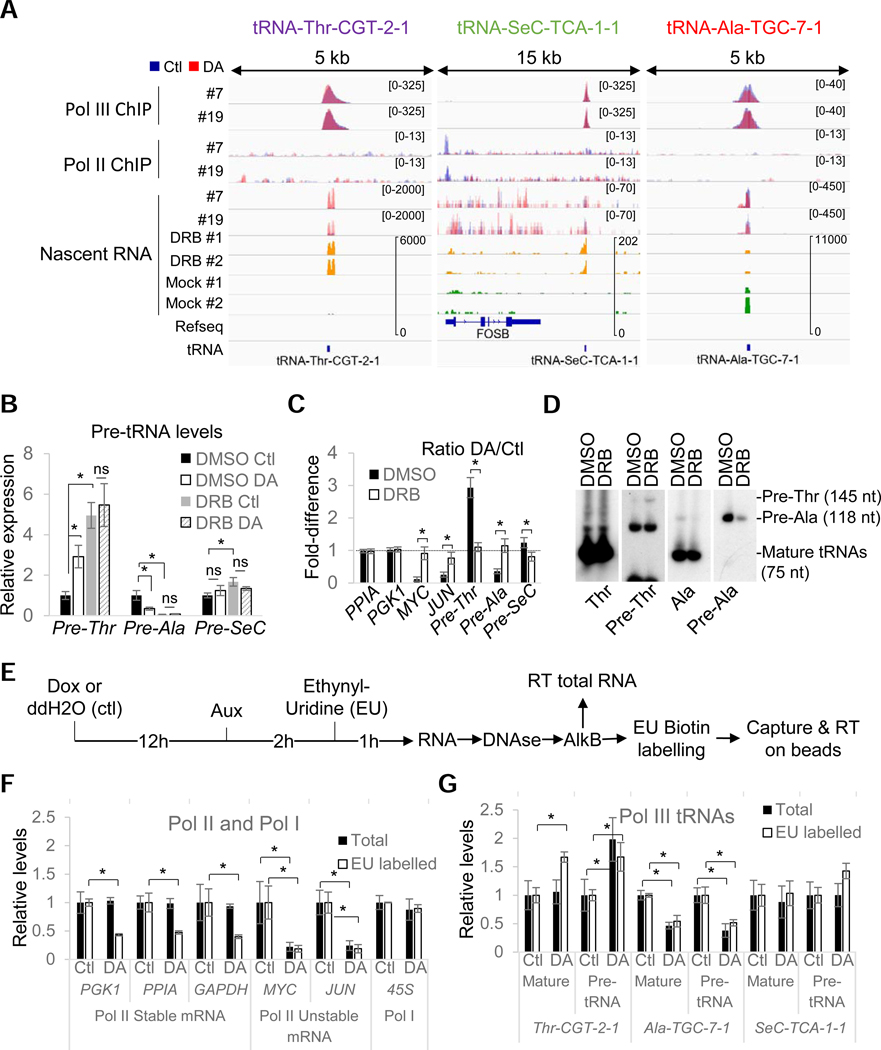
Figure 4. RPB1 depletion affects tRNA transcription rates.
(A) Overlays of input-subtracted RPC62 and RPB3 ChlP-seq coverage and normalized nascent RNA in RPBl-expressing (Ctl, blue) or RPBl-depleted (DA, red) clone #7 and #19 cells. The nascent RNA coverage tracks of DRB-treated (yellow) and mock-treated (green) cells are also shown. (B) Relative RNA expression levels in all three clones normalized to DMSO Ctl in RPBl-expressing (Ctl) or RPBl- depleted (DA) cells pre-treated with DRB or DMSO. (C) DA/Ctl ratios for data presented in (B). (D) Northern blot analysis of mature and pre-tRNAs in HEK293 cells treated with DRB or DMSO. Precursor sizes in HEK293 were obtained from SSB/La PAR-CLIP data from Gogakos et al. (2017). (E) Protocol used for the analysis of demethylated total and ethynyl-uridine (EU) labelled RNAs by RT-qPCR. (F) Relative expression levels of selected Pol I and Pol II RNAs in RPBl-expressing (Ctl) or RPBl-depleted (DA) cells for all 3 clones normalized to their levels under Ctl conditions. Data show the levels in total (Total) or metabolically labelled (EU-labelled) RNAs. (G) Same as (F) but for the three selected mature or precursor tRNAs. Data in (B), (C) and (F), (G) represent the average +/− SD; *p<0.05 (T-test)..

