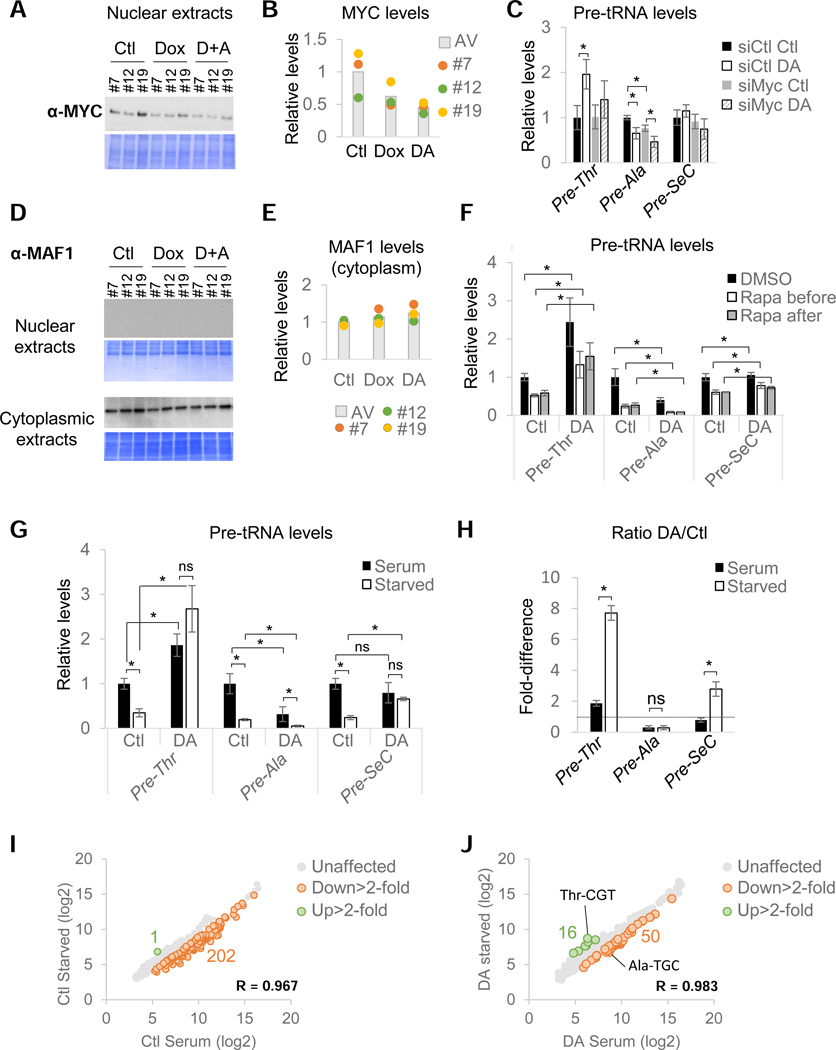
Figure 5. Pol II activity regulates tRNA transcription directly and indirectly and is essential for the repression of most tRNA genes in serum-deprived cells.
(A) MYC immunoblot and corresponding Coomassie-stained membrane of nuclear extracts prepared from untreated (Ctl), Dox-treated and DA-treated cells for all three clones. (B) Quantification of data shown in (A). Histogram represents the average expression levels. (C) Relative pre-tRNA expression levels normalized to siCtl-treated cells for all 3 clones transfected with a non-targeting (siCtl) or MYC-targeting pool of siRNAs (siMyc) prior to RPB1 depletion. (D) MAF1 immunoblots and corresponding Coomassie-stained membrane of nuclear and cytoplasmic extracts. (E) MAF1 protein levels in cytoplasmic extracts prepared from RPBl-expressing or RPBl-depleted cells for all 3 clones. Histograms represent the average expression levels. (F) Relative pre-tRNA levels normalized to Ctl DMSO levels in RPBl-expressing (Ctl) or RPBl-depleted (DA) cells for all three clones treated with Rapa prior to or after auxin addition (see also Figure S5D and S5E). (G) Relative pre-tRNA levels normalized to Ctl cells kept in serum in RPBl-expressing (Ctl) or RPBl-depleted (DA) cells for all three clones cultured in the presence (black) or absence (white) of serum prior to and during RPB1- depletion. (H) DA/Ctl ratios for data shown in (G). (I) Microarray analysis of pools of RNA prepared from all three clones cultured in the presence (serum) or absence of serum (starved) for 20hrs. (J) Same as (I) but for cells treated with DA. Data in (C), (F), (G) and (H) represent the average +/− SD; *p<0.05, ns non-significant (T-test).

