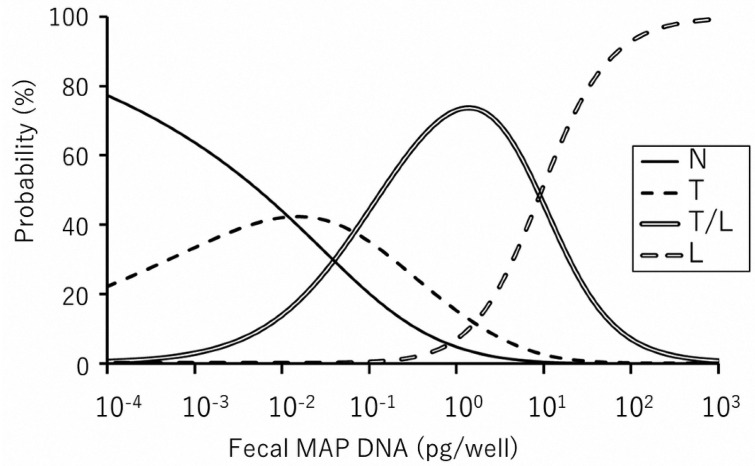
Fig. 2.
Multivariate regression model comparing each disease classification and the amount of Mycobacterium avium subsp. paratuberculosis (MAP) DNA. The graph shows the probability of predicting histopathological lesion types at each amount of fecal MAP DNA. For example, in the presence of 1.0 × 10⁻³pg/well MAP DNA, the following can be predicted: 64% probability to find non-lesional type (N type), 33% probability to find tuberculoid type (T type), and less than 3% probability to find mixed type (T/L type) and lepromatous type (L type). Also, 1.0 × 10²pg/well MAP DNA can lead to following prediction: 93% probability to find L type, 7% probability to find T/L type, and less than 1% probability to find N and T types.

