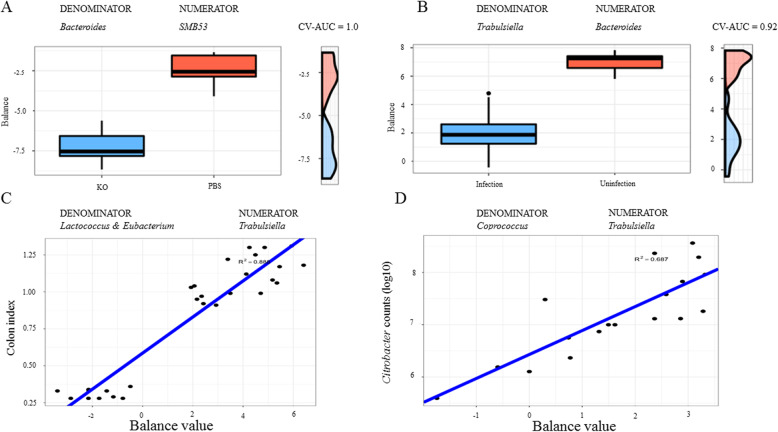
Fig. 9.
Microbial signatures or balances relevant to pathophysiological phenotypes of colitis in mice. Box plots represent the distribution of balance values in each category. The microbial taxa in the balance listed on the top of the chart. a The balance consisting of SMB53 and Bacteroides discriminated KO from PBS controls. b The balance that distinguished the infection status is shown. The right sides of the charts represent the density curve for each category. CV-AUC = cross validation adjusted mean area under the ROC curve (AUC). The balances showing strong associations with colon index (c) and the Citrobacter rodentium bacterial load (counts) in the colon tissue (d). The y-axis represents the numerical values for the colon index (c) and log10 Citrobacter counts (d), respectively. The x-axis is the balance value. The lower balance values were associated with the lower colon index or reduced bacterial loads, or an improved colitis phenotype

