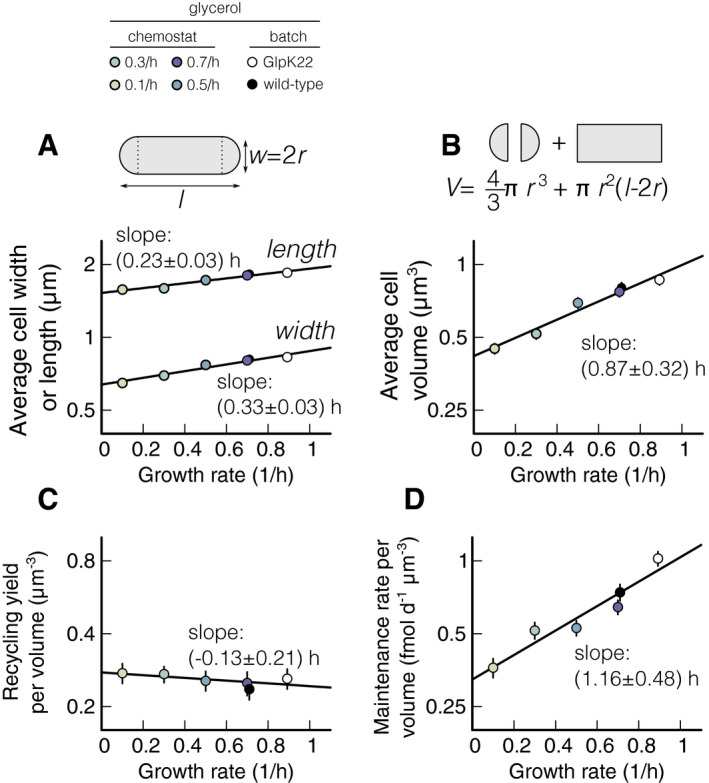
Cell size during starvation. Length and width of the cells are measured with phase‐contrast microscopy, and the volume is computed considering cell shape as a cylinder with two semi‐spheres, as described in the graphical synopsis at the top (see also
Table EV3 and
Methods). Each measurement is an average of 200 cells. (A) Measured length and width of wild‐type cells starved in batch cultures and previously grown in the chemostat at different steady‐state growth rates and of GlpK22 cells starved and previously grown in batch culture at
μ = 0.9 h
−1 (see upper color legend). Note that, as shown in Schink
et al (
2019), cell widths do not change from steady‐state growth to starvation, while lengths decrease. Both length and width increase exponentially with growth rate. (B) Starvation volume of the cells described in panel (A), computed as explained in the graphical synopsis (see also
Methods). In agreement with literature (Schaechter
et al,
1958), it increases exponentially with growth rate (black line).

