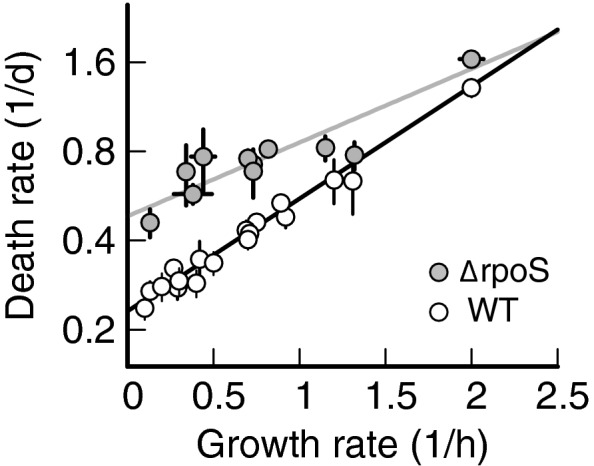
Figure 4. Influence of RpoS knock‐out on the death rate dependence.

Death rates of ∆rpoS mutants versus the growth rate (gray symbols), compared to wild‐type Escherichia coli K‐12 (white symbols, data from Fig 1). Death rate increases with growth rate with a smaller slope (∆rpoS: 0.57 ± 0.13 h) compared to wild type (WT: 0.88 ± 0.13 h). Black and gray lines show linear weighted least square fits to log‐transformed data, which take uncertainty in data points into account (see Methods). Data shown as mean ± SD. Two or three replicates per condition.
