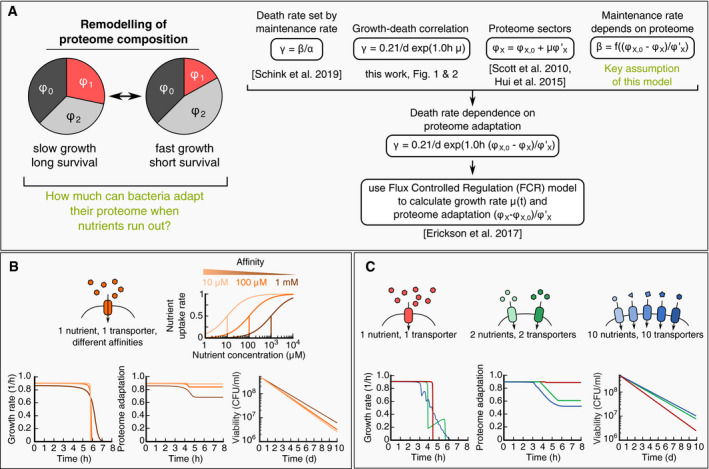
Figure 6. Adaptability during entry to stationary phase.

- Mathematical modeling of death rate changes as bacteria adapt during entry to stationary phase, see Methods for details. The key assumption is that changes in maintenance rate β are due to changes in the proteome. To understand adaption, we thus need to understand how much bacteria can remodel their proteome when nutrients run out (A – left). We combine our key assumption with the following quantitative laws: (i) Death rate is set by maintenance rate; (ii) Proteome sectors depend linearly on growth rate (Hui et al, 2015), and (iii) Adapt at the same time‐scale during nutrient shifts (Erickson et al, 2017). Combined, these relations allow us to compute how death rate depends on the proteome adaptation (A – right). We use the flux‐controlled regulation (FCR) model (Erickson et al), to calculate the relative adaptation in various scenarios.
- Adaptation at the end of growth. When the nutrient concentration decreases, the nutrient uptake rate slows down with a Michaelis–Menten type kinetics (top). Depending on the uptake affinity, bacteria will experience either a sharp or smooth decrease in growth rate (bottom left, bright orange: 10 μM, dark orange: 1 mM). During this slow down, the proteome adapts (bottom center), with lower affinities (dark orange) showing a slight improvement of proteome adaptation, which results in a slightly lower death rate (bottom right).
- Adaptation in complex media. A medium supplemented with multiple nutrients (one – red, two – green, ten – blue) leads to a step‐wise decrease in growth rate during nutrient depletion (bottom left). Due to the extended periods of slow growth after exhaustion of primary nutrients, bacteria can adapt their proteome substantially (bottom center) and decrease their death rate (bottom right).
