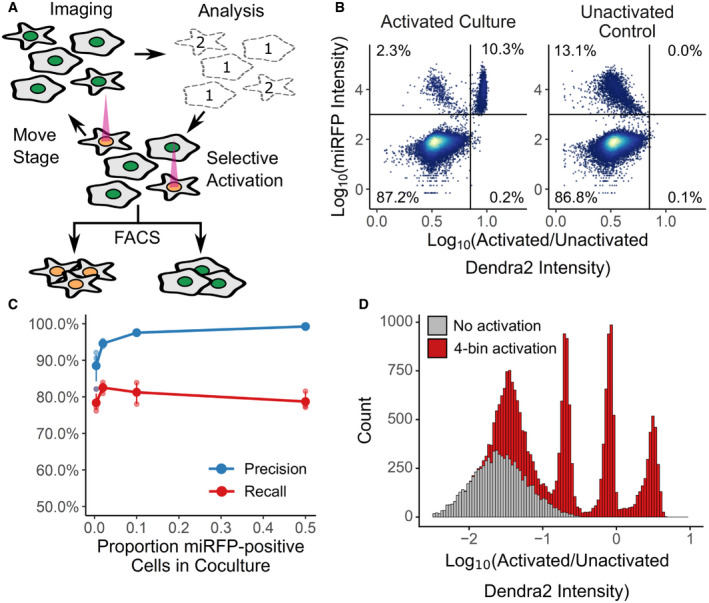
In an automated fashion, cells in a field of view are imaged and their phenotype classified. Cells of interest are illuminated with 405 nm light, which irreversibly photoactivates Dendra2 from its green to its red fluorescent state. The microscope then moves to a new field of view. These steps are repeated across an entire culture well. Then, fluorescence‐activated cell sorting based on Dendra2 photoactivation is used to physically recover cells of interest.
To assess the photoactivation accuracy, U‐2 OS cells expressing nuclear Dendra2 and miRFP, or nuclear Dendra2 alone, were co‐cultured. The microscope was programmed to activate Dendra2 in cells expressing miRFP. Following photoactivation, miRFP expression and the ratio of activated to unactivated Dendra2 (left panel, n = 18,766 cells) were assessed with flow cytometry. In a second co‐culture, Dendra2 was unactivated (right panel, n = 18,395 cells). Lines indicate gates for miRFP‐positive cells and activated Dendra2 cells, with the percentage of cells appearing in each quadrant indicated.
Same experiment as (B), except cells were mixed such that 0.5%, 4%, 12%, or 50% were miRFP positive. Precision and recall were computed; large solid points, mean (n = 3 replicates); small points, individual replicate values; error bars, standard error from the mean.
U‐2 OS cells in one well were illuminated with 405 nm light for 0, 50, 200, or 800 ms (red; n = 16,397). Cells in a second well were left unactivated (gray; n = 8,497). The ratio of activated to unactivated Dendra2 was determined by flow cytometry.

